
Table of Contents
Housing market prices are at record highs even as transaction volume stays historically soft — not the recovery most housing market predictions called for heading into 2026. The national median existing-home price reached $429,300 in May 2026, and while existing-home sales ticked up 3.2% that month to a seasonally adjusted annual rate of 4.17 million units, volume remains far below historical norms with no clear catalyst for a sustained rebound.
This guide breaks down where prices stand today, what mortgage rates are doing to affordability, and which trends will shape the market through the rest of 2026 — so you can make informed real estate decisions.
Where Home Prices Stand Right Now
Prices are still climbing, but the current housing market looks nothing like the boom that defined 2021 and 2022. Growth has decelerated to just 1.3% year over year as of May 2026, compared to gains exceeding 15% at the pandemic peak. The story varies sharply depending on where you look.
"Year-over-year changes in home prices have varied widely by state. Home prices in states like Illinois, Kansas, and Wisconsin have increased by more than 5% over the past 12 months, whereas states like Colorado, New Mexico, and Washington have seen prices fall by more than 1% over the same period."
— Chris Stroud, HouseCanary Chief of Research
National Median Home Prices
Prices are up 1.3% year-over-year, according to NAR's May 2026 report — the 35th consecutive month of annual increases. Among the most consistent housing market trends of the past three years, sustained price growth alongside soft sales volume stands out. Prices are holding because supply is too constrained to give buyers leverage, not because demand is surging.
Negotiating room has opened slightly in some markets, but steep price drops are not on the horizon. Seller equity remains intact. The more relevant question for anyone buying or selling right now is whether the buyer pool in their specific market is deep enough to support the price they're asking.
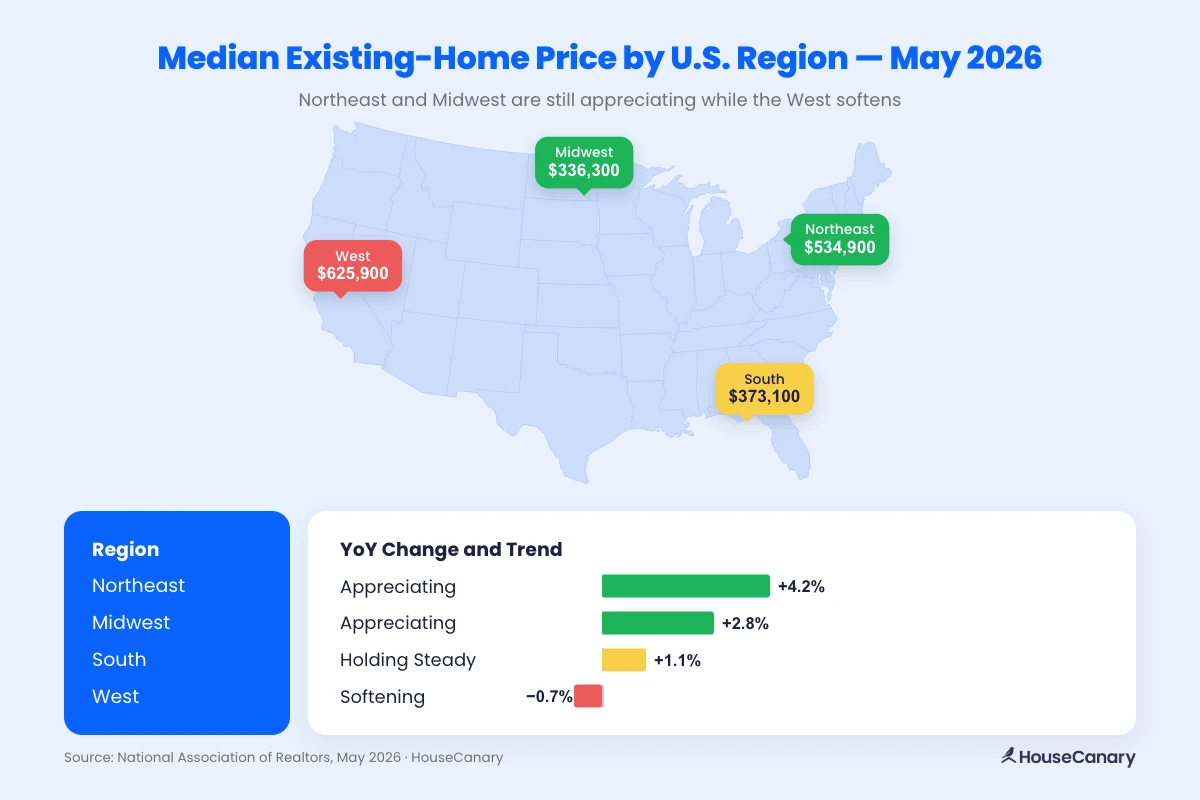
Regional Price Variation
Regional price trends are diverging sharply in 2026, driven by differences in inventory, job growth, and migration patterns. The housing market prices chart below breaks down where each region stands today.
Inventory Levels and Their Effect on Prices
Inventory in the current housing market is recovering but remains constrained. Unsold inventory stood at 1.55 million units in May 2026 — up only marginally from 1.54 million a year earlier — representing 4.5 months of supply, still well below the 5 to 6 months that characterize a balanced market.
The shortage is hitting entry-level buyers hardest. Homeowners locked into 2020–2022 rates have little incentive to sell and upsize at today's prices, keeping the starter-home supply especially thin. Move-up and luxury inventory has recovered more in Sun Belt markets where new construction has added supply, giving buyers in higher price tiers more options and more room to negotiate.
How Mortgage Rates Shape Housing Affordability
No single variable shapes housing market interest rates and accessibility more than the 30-year fixed rate. A shift of even half a percentage point changes what buyers can qualify for, which properties work for investors, and how lenders price risk.
The Rate-Price Relationship
On a $400,000 home, a single percentage-point increase in the rate adds roughly $260 to the monthly payment. That changes what buyers can qualify for and which deals make sense for investors evaluating investment property financing.
The 30-year fixed rate averaged 6.47% as of June 18, 2026, down from a peak of nearly 8% in October 2023 and from 6.81% a year ago. Most forecasters expect rates to hold in the low-to-mid 6% range through year-end. That is directionally positive, but as the table shows, today's buyer is still paying meaningfully more per month than someone who purchased the same home three years ago at a lower price and a lower rate.
"While mortgage rates have cooled from their 2023 peak, prices are currently at or near record highs in most markets. Consequently, buyers are still paying at least as much per month as they were three years ago. The rate matters, but so does the price they're buying at."
— Chris Stroud, HouseCanary Chief of Research
Affordability Metrics Buyers Should Track
Two metrics give the clearest read on where affordability stands today:
- Debt-to-income ratio (DTI): The share of a buyer's gross monthly income that goes toward debt payments, used by lenders to determine qualification. At today's rates, hitting the conventional 43% DTI cap is harder than it was two or three years ago. First-time buyers without equity from a prior sale feel that squeeze most acutely.
- NAR Housing Affordability Index: A score measuring whether a median-income household can qualify for a mortgage on a median-priced home, where 100 means they can just afford it. The index sat at 105.6 in May 2026, up from 97.5 a year ago — but it has ticked down in recent months and still sits well below the 160-plus readings seen before rates began rising in 2022. Affordability is improving slowly off its lows, not snapping back.
How Sales Activity Is Shaping the 2026 Market
Sales activity tells a more nuanced story than prices alone. Existing-home sales rose 3.2% in May 2026 to a seasonally adjusted annual rate of 4.17 million units — but that uptick is better read as noise on top of a still-soft market than the start of a sustained recovery. With prices near record highs and rates still elevated, there is little catalyst for volume to return in the near term.
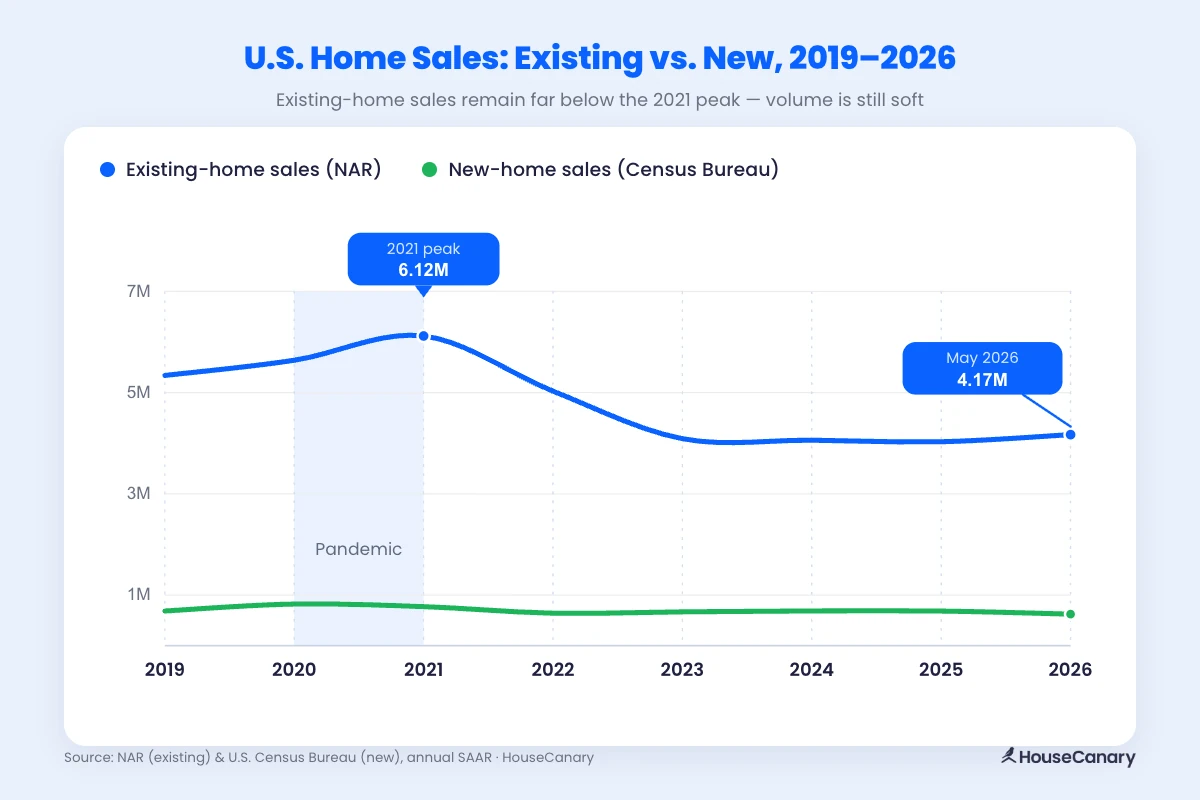
Existing-Home Sales
Existing-home sales rose 3.2% in May 2026 to a seasonally adjusted annual rate of 4.17 million units, but volume remains near multi-decade lows. The primary drag is still the rate lock-in effect: homeowners who secured rates below 4% during the pandemic have little financial incentive to sell and take on a new mortgage at today's rates.
That dynamic is not playing out the same way everywhere. Regional conditions vary significantly:
- Northeast and Midwest: Tight inventory is keeping competition alive, even with fewer total transactions.
- South and West: Slower demand and rising inventory have given buyers more room to negotiate, with days on market climbing as sellers lower their asking prices.
New Construction and Its Effect on Resale Prices
Housing starts and building permits are leading indicators of future supply — more construction today means more inventory hitting the market 12 to 24 months from now. U.S. Census Bureau data puts privately owned housing starts at a seasonally adjusted annual rate of 1.18 million units in May 2026 — the slowest pace since the first half of 2020. That cooling pipeline points to tighter supply ahead, not looser.
That activity is not evenly distributed across the country:
- South and West: Account for the majority of new construction activity, though starts have moderated as builder confidence softens in oversupplied markets.
- Northeast and Midwest: Construction remains limited by land constraints, zoning restrictions, and higher labor costs, reinforcing the supply shortage and keeping prices elevated in those regions.
Housing Market Price Trends to Watch
Prices, rates, and inventory explain where real estate trends stand today. But three underlying trends are reshaping where demand is heading and which markets are best positioned heading into 2027 and beyond:
- Where people are choosing to live
- How household structures are evolving
- The growing role of institutional capital in single-family homes
Migration Patterns and Demand Shifts
Domestic migration has reshaped regional housing demand over the past three years, with Americans consistently moving toward mid-sized cities that offer affordability and job access. North Carolina, South Carolina, and Tennessee have topped inbound migration lists for four consecutive years, keeping prices supported even as national sales volume stalls.
The markets seeing the strongest inbound migration pressure include:
- Charlotte, NC: A consistent top inbound city driven by finance and technology job growth, with home prices rising alongside population.
- Boise, ID: Attracting affordability-driven buyers from the Pacific Northwest for the second consecutive year.
- Columbus, OH: Part of a broader Midwest shift, as the region saw positive net domestic migration for the first time this decade in 2025, driven by lower home prices and a strong job base.
Not all migration flows to the same places. HouseCanary's ZIP code–level data shows some of the fastest-appreciating markets are in the Midwest and Northeastern suburbs, where buyers get more space at lower price points than in comparable city neighborhoods. Migration patterns can also shift quickly when major employers change remote-work policies, which makes real-time data essential for investors in migration-sensitive markets.
The Rise of Multigenerational Living
In 2025, 17% of homebuyers purchased a multigenerational home — a share that has grown as mortgage rates stay elevated, buyers remain in place, and adult children delay independent homeownership. But the housing stock available to meet that demand is not evenly distributed. HouseCanary's 2026 Multigenerational Living Index breaks down where families have the most structural flexibility:
- Utah: 41% of homes offer 4+ bedrooms, nearly double the national benchmark, with a contained upsizing premium of 1.39x.
- Minnesota and Ohio: High basement prevalence (65% and 71%) gives families more ways to add space without major renovations.
- Arkansas and Louisiana: Just 7% to 8% of homes offer 4+ bedrooms, with upsizing premiums approaching 1.86x.
In constrained markets, buyers face steep tradeoffs between space and cost. For builders and investors, those same constraints point to unmet demand in new construction, ADUs, and purpose-built multigenerational designs.
The Role of Institutional Investors in Local Markets
Institutional single-family home buying gets more attention than its scale warrants. Large entities purchasing homes as rentals represent a fraction of total transactions, concentrated mostly in Sun Belt metros where lower price points make acquisitions viable:
- Institutional investors hold roughly 0.35% of the single-family housing stock nationally and account for about 3% of single-family rentals.
- Small investors owning 10 properties or fewer account for more than 90% of the investor-owned market.
- Concentration is highest in Sun Belt metros like Atlanta, Phoenix, and Las Vegas.
In January 2026, an executive order restricting large institutional investors from buying single-family homes added new uncertainty, though the affordability debate remains unsettled. The data tells its own story: large institutional investors are already net sellers, with many pivoting toward build-to-rent. For small investors, that retreat creates openings in markets where institutional competition has historically been strongest.
How HouseCanary Uses Predictive Analytics for Market Forecasting
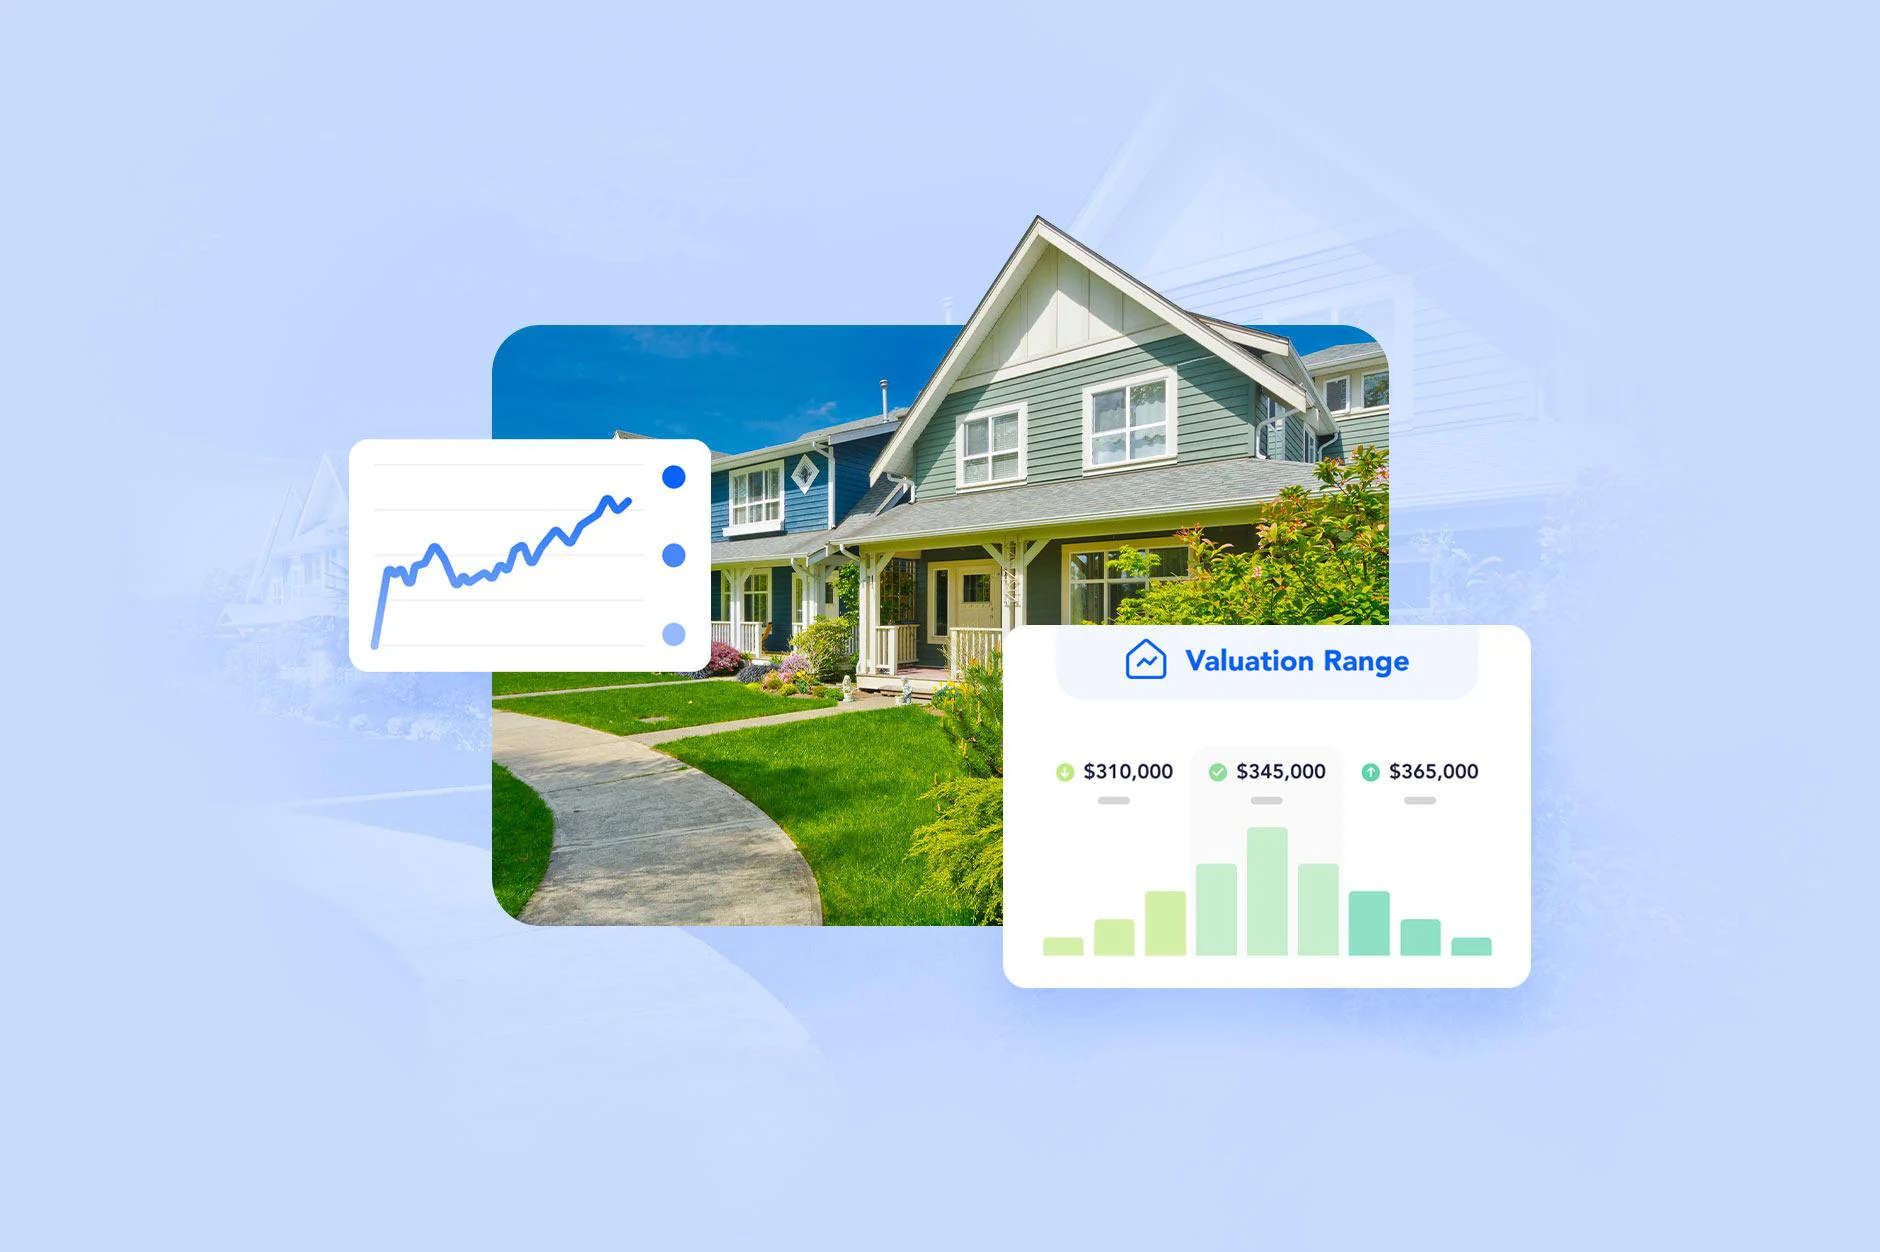
Accurate real estate decisions depend on reliable, up-to-date data. HouseCanary's valuation models draw on more than 136 million residential properties and use machine learning to generate property-level price forecasts.
You'll see forecasted sale and rental values, high-similarity comparables, as-repaired values, and trend direction at the ZIP code level — the signals you need to decide whether a property is worth pursuing before you spend time underwriting it. HouseCanary's Investment Analytics tools extend that to income potential and cap-rate performance so you can evaluate a property's full financial picture. For agents, that data translates directly into stronger lead generation and listing presentations that are harder to argue with.

Housing Market Prices FAQ
Will mortgage rates drop below 6% in 2026?
Most forecasters expect rates to hold in the low-to-mid 6% range through year-end. The 30-year fixed-rate mortgage averaged 6.47% as of June 18, 2026, down from 6.81% a year prior. Buyers waiting for 2020-to-2022 rates should plan around today's numbers instead.
Which states have the most housing inventory right now?
Florida, Texas, and Arizona are carrying the heaviest inventory loads, giving buyers more negotiating leverage than they have had in years. The Northeast and Midwest remain well below pre-pandemic norms, with sellers still holding pricing power.
How do I know if a local market is softening or still competitive?
Watch months of supply, days on market, and the share of homes selling above list price for the most accurate real estate market updates. NAR projects 4% national price growth in 2026, but local price growth varies significantly. HouseCanary's property-level data helps you read conditions at the ZIP code level.
Is now a good time to buy a home?
It depends on your market and financial position. Inventory-rich Sun Belt markets offer more room to negotiate, while tighter Midwest and Northeast markets still favor sellers. The more useful question is whether today's monthly payment works for you, with refinancing as an option if rates ease.