September 2026 Housing Market: Single-Family Market Under Rate Pressure

Chris Stroud



HouseCanary
AVMs with a 2.7% median error, plus the comps and forecasts agents and investors rely on.
Explore PlansHouseCanary's September 2026 Market Pulse shows a single-family detached housing market still in balance, but showing initial signs of stress as interest rates rise quickly and home prices sit near record highs. Contract volume fell 10.8% and net new listings fell 15.2% versus September 2025, the first double-digit joint decline in buyer and seller activity since 2025. Total inventory is up 10.6% year-over-year, months of inventory stands at 5.46, and median days on market rose to 55, up from 54 one year ago.
Total single-family detached inventory rose 10.6% year-over-year in September, continuing the return to average historical levels even as net new listings decline. Measured against September 2024, inventory is up 22.1%.
Months of inventory stands at 5.46 — a neutral reading that is trending toward buyer's-market territory. Median days on market increased modestly to 55 days, up 1.9% from 54 days one year ago.
Buyer and seller activity both slipped by double digits in September, their sharpest joint decline in over a year. 253,751 single-family detached properties went under contract, down 10.8% versus September 2025, while net new listings fell 15.2% to 241,970. The decline in net new listings was driven by a 7.5% decrease in new listing volume combined with a 20.5% increase in removals.
Over the trailing 52 weeks, contracts totaled 2,887,658, down 1.2% year-over-year, while net new listings of 2,878,708 were down 2.9%. With contracts running ahead of net new listings, net new inventory was negative across both windows — down 8,950 units over the past 52 weeks and down 11,781 in September alone.
Single-family detached prices exhibited stability in September. The median listing price was $450,653, down 0.7% year-over-year, while the median closed price rose 3.9% to $433,765. Month-over-month, the median listing price decreased 0.7%, reflecting typical seasonality, while the median closed price edged up 0.3%.
On a per-square-foot basis, the median listed price-per-sqft is $237.7 (down 0.8% YoY) and the median closed price-per-sqft is $240.2 (up 2.3% YoY). The sale-to-list price ratio stands at 97.7%, and price cuts are up 5.3% versus September 2025, remaining near multi-year highs.
The single-family detached rental market saw inventory contract 18.1% year-over-year, and it now sits 6.2% below September 2024 levels. The median listed rent increased 0.9% year-over-year to $2,457, while month-over-month rents are down 1.3%.
The condo market — which includes townhomes, rowhomes, and other single-family attached units — continues to run more buyer-friendly than the detached segment. Total condo inventory is up 12.6% year-over-year and up 26.2% versus 2024. Months of inventory stands at 7.06, squarely in buyer's-market territory, while median days on market held at 66 days, unchanged from one year ago.
Condo activity fell even more sharply than single-family detached. 51,065 condos went under contract in September, down 16.3% year-over-year, while net new condo listings fell 20.0% to 53,474. That decline was driven by an 8.3% decrease in new condo listing volume combined with a 26.1% increase in removals.
Condo pricing remains softer than detached. The median condo listing price was $391,371, down 3.7% year-over-year, while the median closed price was $383,320, down 0.4% — unlike single-family detached, where closed prices are still rising. The sale-to-list ratio for condos sits at 96.7%, and condo price cuts are up 2.3% compared with September 2025. In the condo rental market, the median listed rent fell 1.1% year-over-year to $2,311, while condo rental inventory declined 5.8%.
All single-family figures below reflect Single-Family Detached (SFD) homes; condo metrics are summarized in the Condo Market section above.
The September 2026 Market Pulse shows a U.S. housing market still in balance but under pressure. Inventory keeps rebuilding while buyer and seller activity both fell by double digits, against a backdrop of rapidly rising interest rates. Should rates remain elevated over the coming months, HouseCanary expects a reversal of the positive trends observed through much of 2026: supply improvements, steady buyer activity, and steady price growth.
Explore the full September 2026 Market Pulse Report to access detailed data, trends, and regional breakdowns shaping today's housing market.

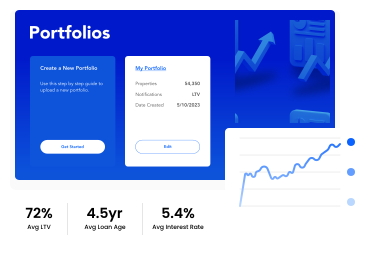
Streamline your portfolio management with automated updates that ensure you're always in the know.



We build groundbreaking technologies to improve and accelerate residential real estate operations.