
Table of Contents
HouseCanary
Know what any property is really worth.
AVMs with a 2.7% median error, plus the forecasts and comps top lenders trust.
Explore PlansTemperatures may be dropping, but the home flipping market is heating up in several zip codes. Even in a tight market, this season brings opportunities in moderately priced areas where motivated sellers and less competition make flips more achievable.
Our fall flip forecast highlights the hottest zip codes to flip in 2025. HouseCanary’s proprietary data was used to form a “flip score” across thousands of properties nationwide, giving investors data-backed insights into the most profitable zip codes.
Using this methodology, we ranked and scored the top locations to identify the most promising opportunities. Let’s dive into the top zip codes, real estate market trends, and tips for investors looking to make a move.
Key Takeaways
- High-return hotspots: Affordable zip codes with rapid price growth, like Gary, IN, and Jackson, MS, offer investors strong potential for profitable flips this fall.
- Seasonal and regional insights: Knowing the average time to sell a house by zip code and tracking seasonal trends helps investors plan renovations and listing schedules.
- Data-driven decisions: Tools like HouseCanary’s Property Explorer and AVM forecasts give investors the insights needed to reduce risk and find the best opportunities.
- Hidden opportunities in smaller markets: Smaller or mid-sized cities can deliver outsized returns, showing the value of ZIP-level analysis for finding overlooked flip opportunities.
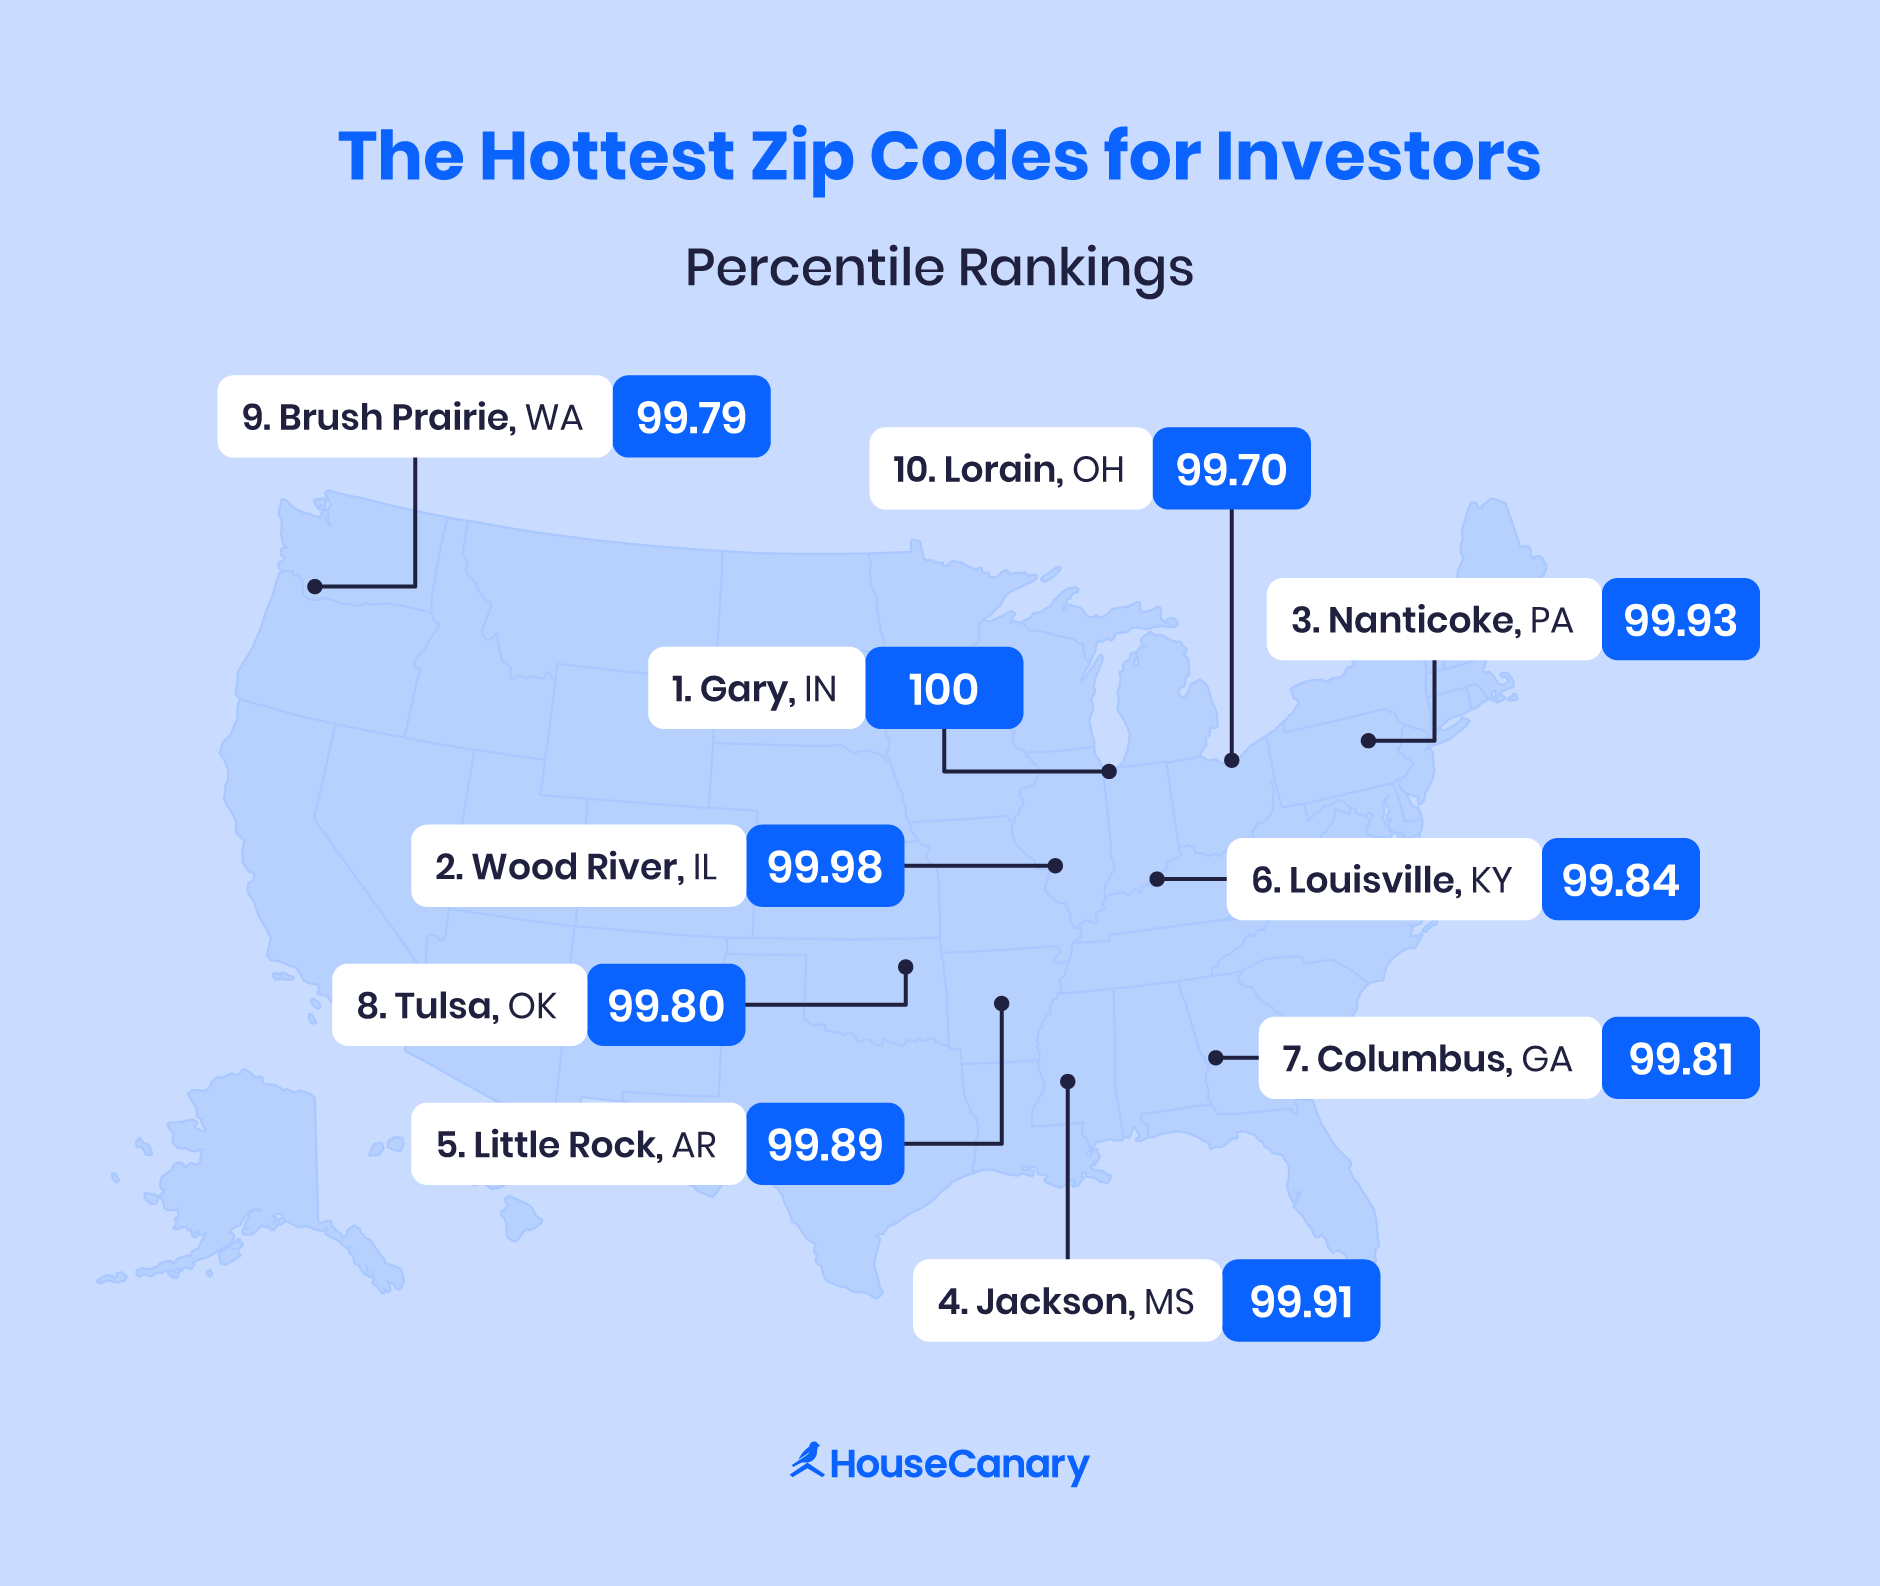
Top 10 Cities to Flip in Fall 2025
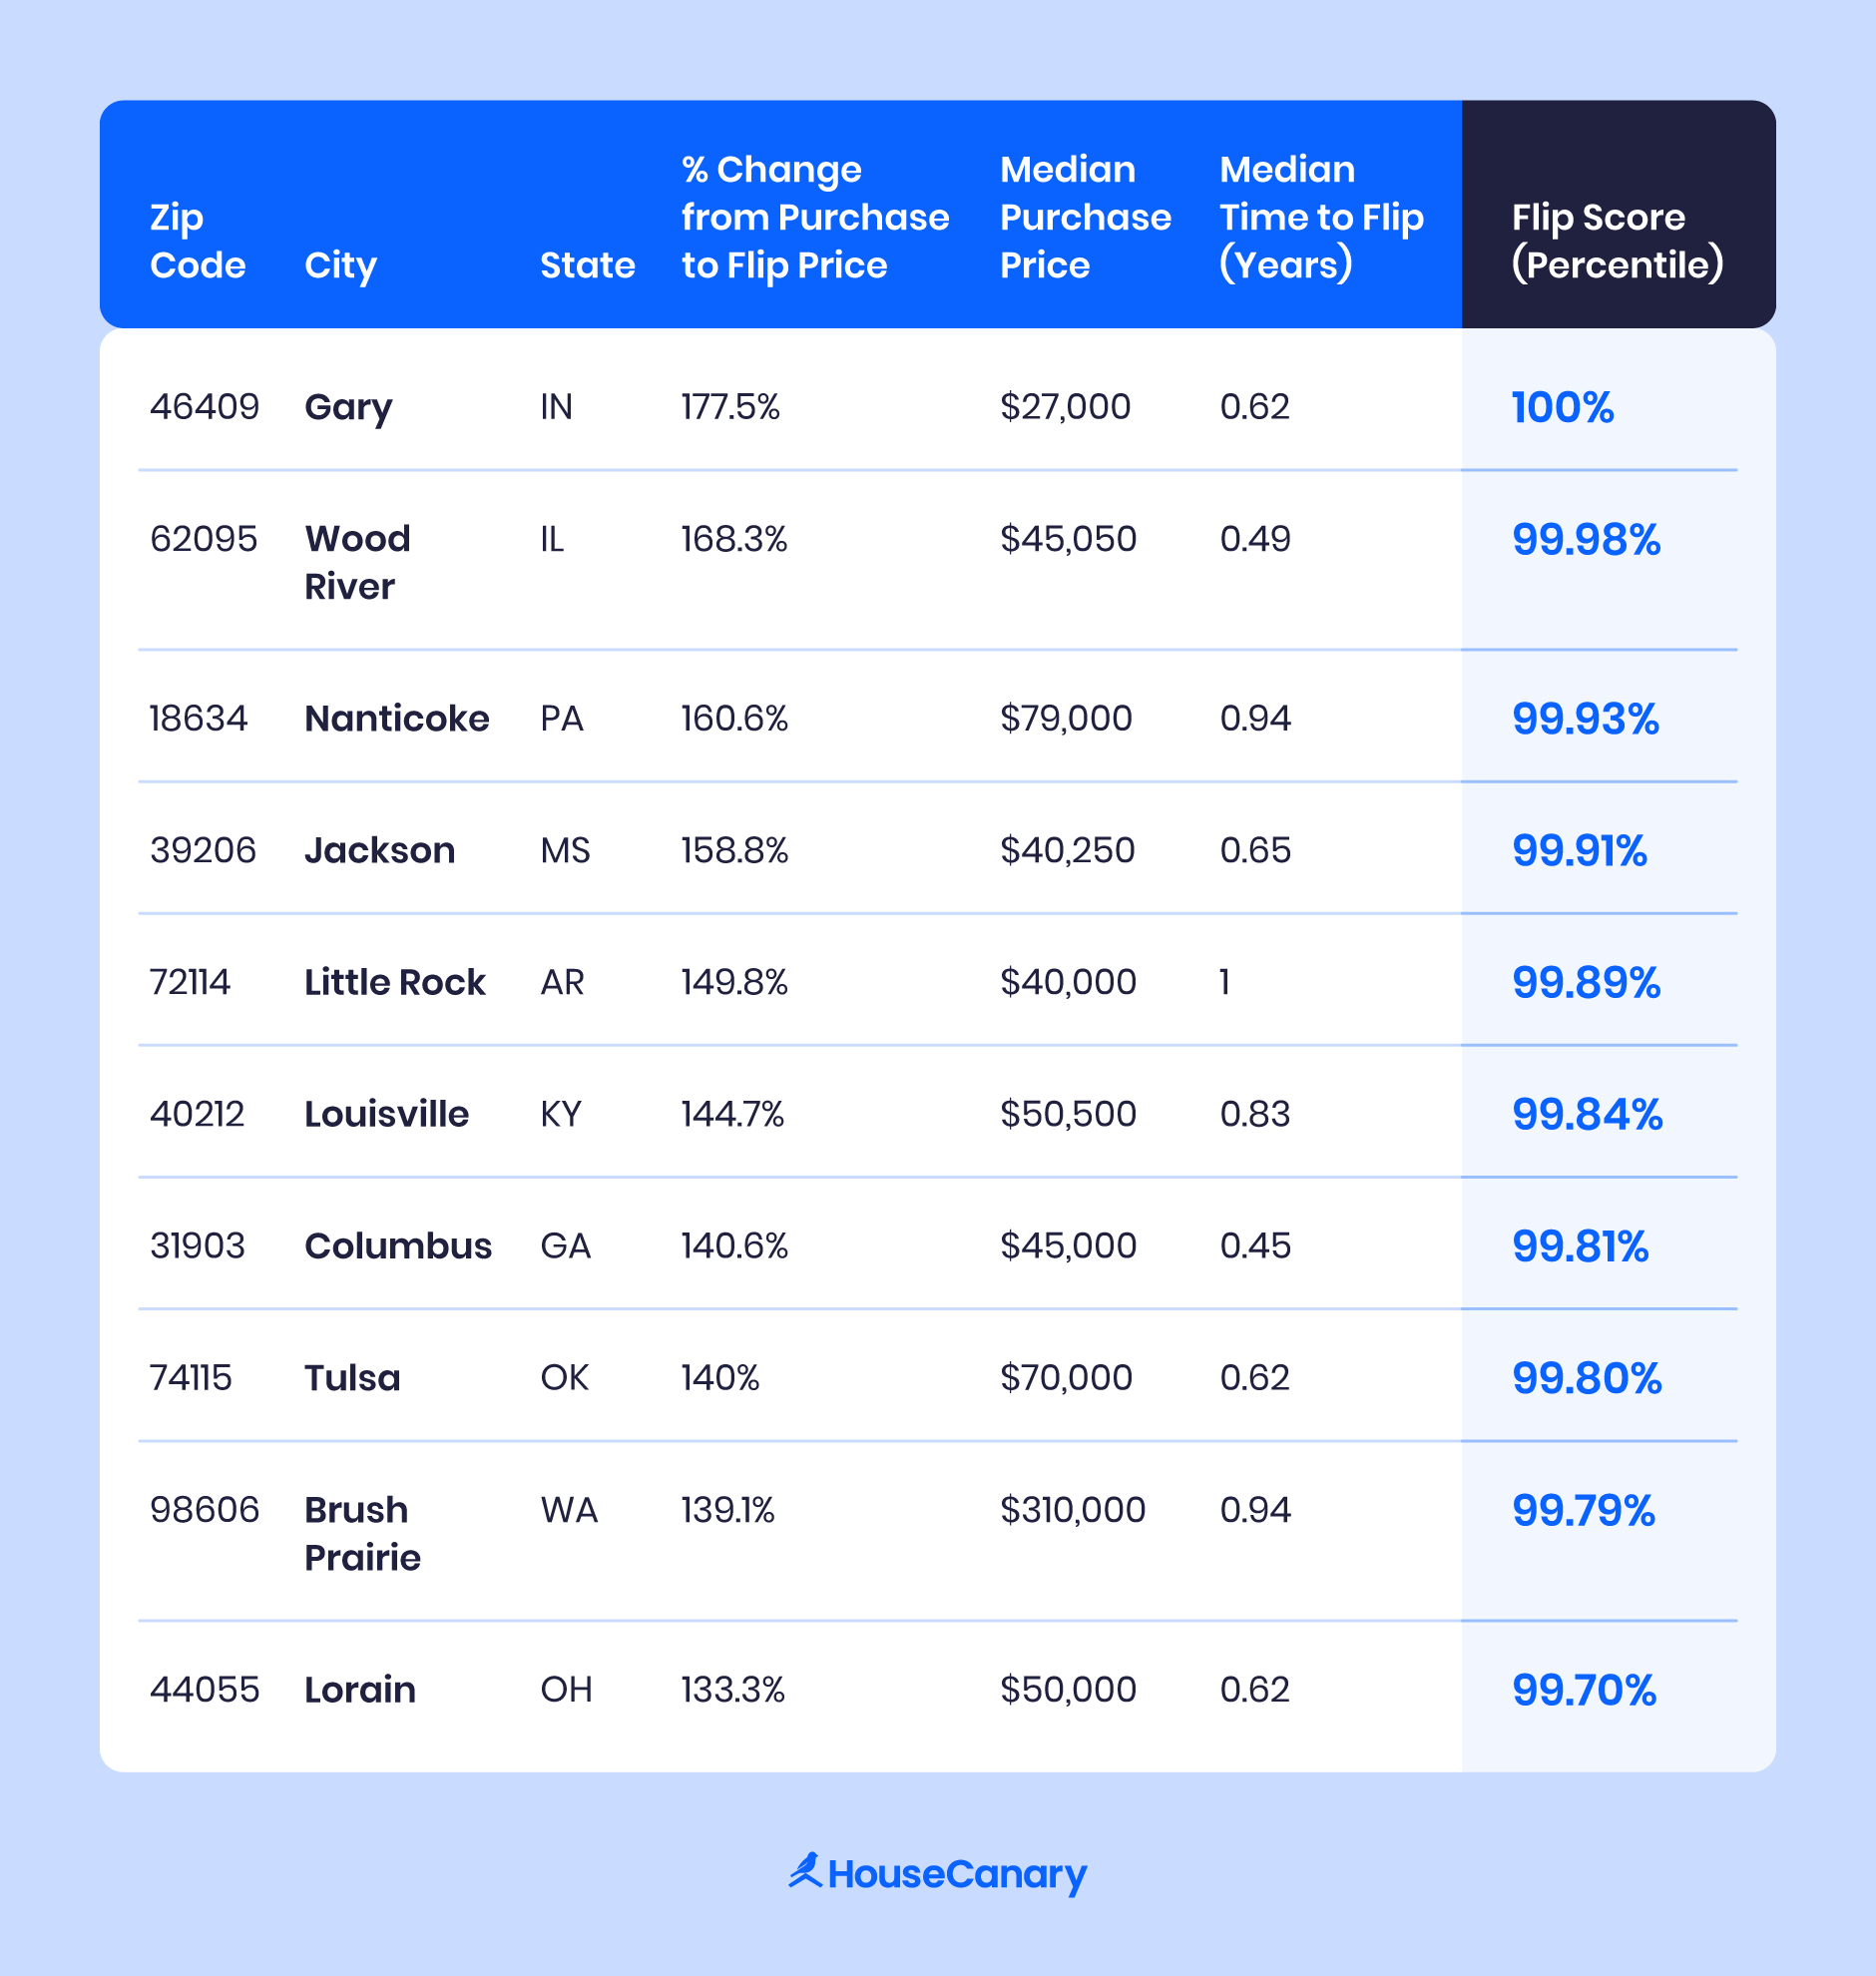
To help investors zero in on the best opportunities this fall, we ranked markets using HouseCanary’s proprietary flip score. This score highlights zip codes where profit potential, affordability, and market conditions align to create the strongest flipping opportunities.
1. Gary, Indiana
Gary tops the list with a flip score in the top 100th percentile, making it one of the hottest markets for home flippers. Median purchase prices are $27,000, and properties turn over quickly, offering strong potential for fast, high returns.
2. Wood River, Illinois
Wood River comes in second with a flip score in the 99.98th percentile, offering strong potential for flippers. Median purchase prices hover around $45,050, and the market shows an impressive 168.3% change between purchase and flip price.
3. Nanticoke, PA
Nanticoke ranks third with a flip score in the 99.93rd percentile, placing it among the nation's elite markets for property flippers. Median purchase prices are approximately $79,000, and the market shows a massive 160.6% change between purchase and flip price. Properties here typically turn over in about 11 months.
4. Jackson, Mississippi
Jackson, Mississippi, comes in fourth with a flip score in the 99.91st percentile, indicating exceptional profit potential. Median purchase prices are low, at around $40,250, and the market demonstrates a strong 158.8% change between purchase and flip price. A quick turnover of approximately 8 months adds to its appeal.
5. Little Rock, Arkansas
Little Rock is fifth on our list, with its flip score landing in the 99.89th percentile. This Arkansas city is an attractive option, featuring median purchase prices around $40,000 and an impressive average appreciation of 149.8%. However, properties may take slightly longer to flip, with a median time of 12 months.
6. Louisville, Kentucky
Louisville secures the sixth spot with a flip score in the 99.84th percentile. This market is marked by moderate entry costs, with median purchase prices around $50,500. The potential for high returns is solid, exhibiting a change between purchase and flip price of 144.7%, and flips are completed in a median of 10 months.
7. Columbus, Georgia
Columbus, Georgia, ranks seventh with a flip score in the 99.81st percentile. It stands out for its exceptionally fast turnaround, with a median time to flip of just 5 months. Flippers here are acquiring properties for a median price of around $45,000 and seeing a 140.6% change between purchase and flip price.
8. Tulsa, Oklahoma
Tulsa, Oklahoma, is ranked eighth, with a flip score in the 99.80th percentile. Flippers in this market enjoy low median purchase prices of $70,000 and impressive returns, with the median change between purchase and flip price hitting 140%. Properties typically take 7 months to turn over.
9. Brush Prairie, Washington
Brush Prairie is ninth on the list, representing the Pacific Northwest with a flip score in the 99.79th percentile. This market requires a significantly higher median purchase price of $310,000, but still yields strong results with a 139.1% change between purchase and flip price. The median time to flip is approximately 11 months.
10. Lorain, Ohio
Rounding out the top ten is Lorain, Ohio, with a flip score in the 99.70th percentile. This market presents affordable entry with median purchase prices around $50,000, and it shows a strong change between purchase and flip price of 133.3%. Flippers here typically complete their projects in about 9 months.
Market Trends Driving These Hot Spots
Fall is a transitional period where you can spot prime investment opportunities and use housing market forecasts to your advantage. Motivated sellers may be more likely to negotiate following the summer rush, and cooler weather can lead to less competition.
Understanding these trends can help you anticipate seasonal slowdowns and optimize listing schedules for more profitable flips.
South and Midwest Offer Flipping Potential
Affordable entry prices and quick turnover make these regions ideal for investors looking to maximize ROI. Fast-moving markets allow for shorter holding periods and quicker capital recycling.
Northeast Shows Moderate Growth
While entry prices are higher than in the South and Midwest, demand remains strong. You can expect steady appreciation, making it suitable for moderate-risk flips with consistent resale potential.
West Faces Higher Barriers to Entry
Higher purchase prices and slower turnover create challenges for investors. Flips require careful budgeting, longer holding periods, and strong exit strategies to remain profitable.
Interest Rate Cuts Lower Borrowing Costs
Recent reductions in interest rates make financing flips more accessible. You can leverage lower borrowing costs to fund multiple projects or larger renovation budgets.
These trends align with the highest flip score markets being concentrated in more affordable states, where seasonal slowdowns and regional pricing advantages give flippers an advantage.

Tips for Investors Looking for Their Next Property
If you’re on the hunt for your next investment property, the goal is to maximize potential returns while minimizing risk. Data-driven strategies and a strong network can help you identify properties that offer the best combination of appreciation potential, renovation feasibility, and resale opportunities.
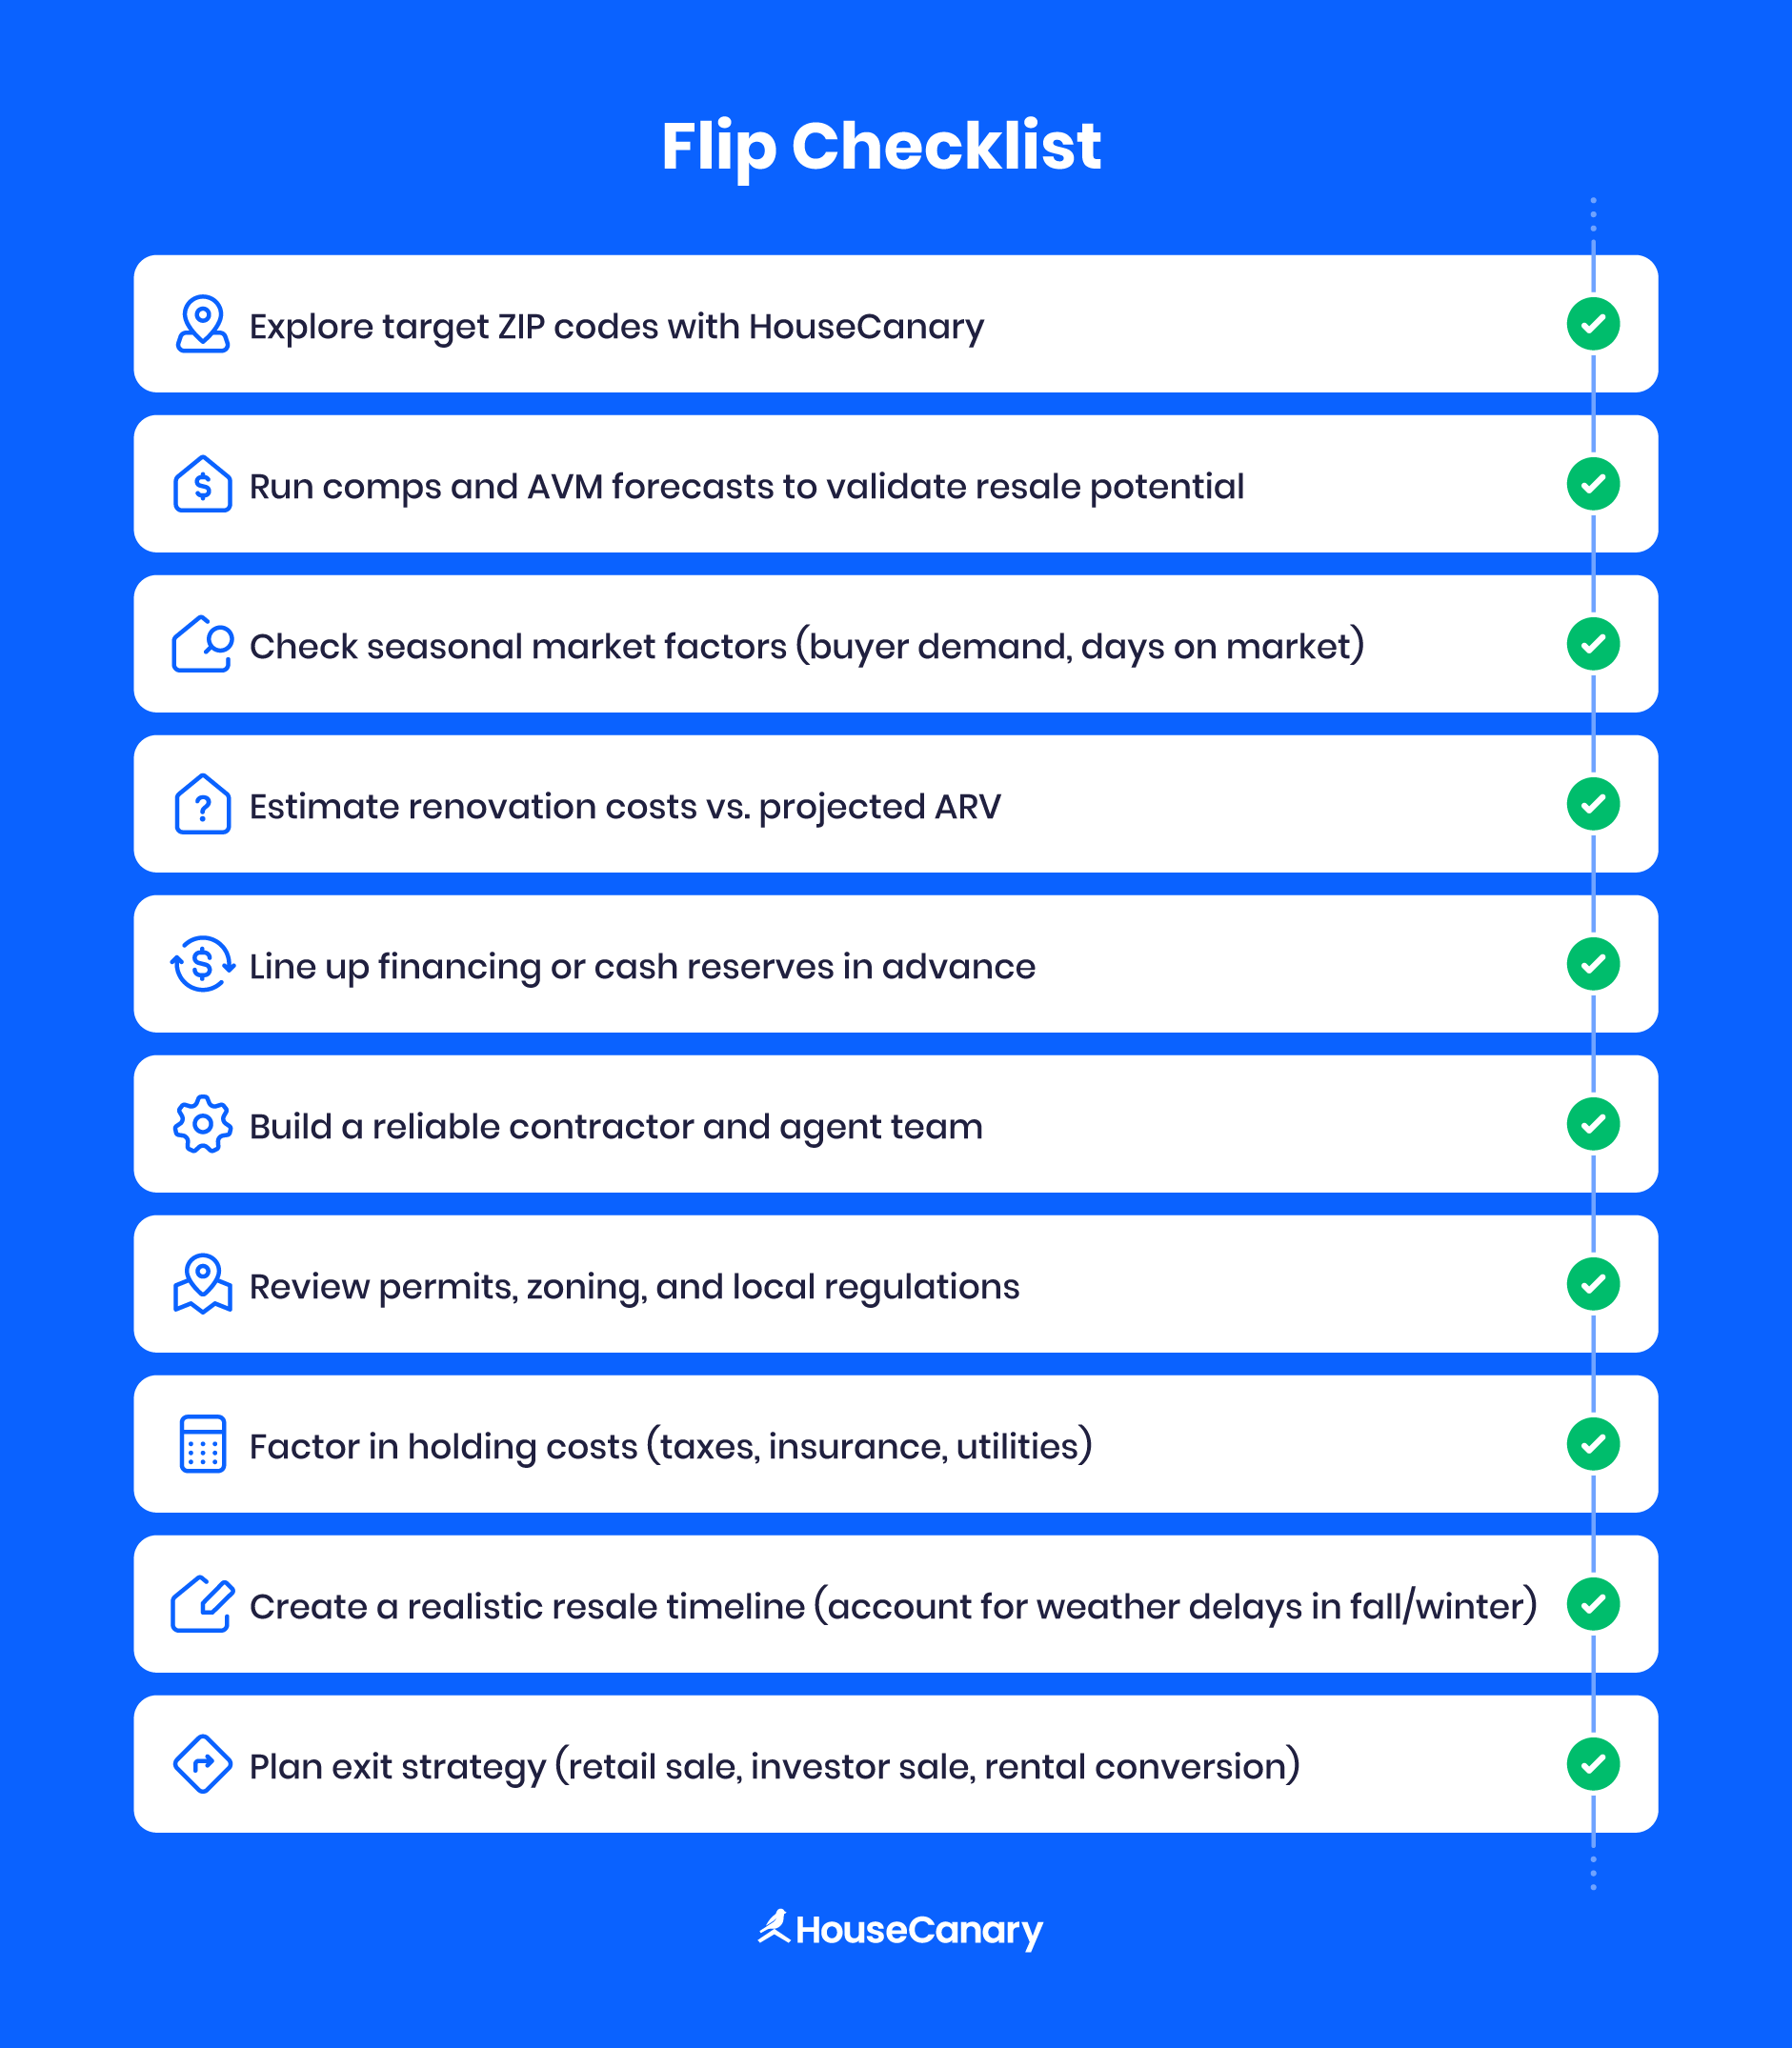
Here are some of the top tips:
- Look past the headline markets: Evaluate properties at the ZIP-code level using HouseCanary’s Property Explorer.
- Find balance: Prioritize appreciation potential alongside renovation feasibility and resale timelines.
- Pay attention to seasonal factors: Shorter days, weather delays, and limited permit office hours can affect your project schedule.
- Use AVM tools: Use automated valuation models to research comps to validate purchase vs. resale pricing.
- Build relationships: Connect with contractors, real estate agents, and loan officers before committing to a property.
These strategies can help you speed up your search, reduce risk, and use data to better evaluate potential investments.
Avoid These Common Flipping Mistakes
While flipping a property is exciting, it can also be time-consuming if not approached correctly. Here are some common mistakes first-time flippers make and how to address them:
- Overestimating ARV: Calculating an accurate after-repair-value is essential. Overestimating can eat into profits or even lead to losses. Always validate with comps and reliable valuation tools.
- Underestimating seasonal costs: Shorter days, weather-related delays, and higher utility bills in colder months can
- stretch both your budget and your timeline.
- Ignoring permit delays: Renovation timelines can be derailed by local permit office schedules. Build in extra time for approvals and stay proactive with paperwork.
Planning ahead and accounting for these risks can help investors sidestep costly surprises. For example, tools like CanaryAI (HouseCanary’s AI-powered real estate assistant) let you search properties by specific features, analyze valuations, and better manage timelines with real-time data.
How HouseCanary Helps Investors Find the Best Opportunities
This fall, the home flipping market offers plenty of opportunities for investors who know where to look. HouseCanary helps you look beyond traditional methods and source the best investment properties for your unique needs.
You can create custom Buy Boxes based on your criteria, evaluate properties in the hottest zip codes, and search active listings through an interactive map, all in one real estate investment software solution.
Get started with Acquisition Explorer to identify top flip opportunities and make the most of your investments this fall.
Methodology
The Flip Score used for these rankings is based on the median percentage change, which is the direct measure of potential gross profit margin between a property's purchase price and its final flip sale price in a given ZIP code. To determine how hot a market is relative to the rest of the country, the Flip Score is presented as a percentile rank (e.g., 99.98th percentile) of this median percentage change value across all ZIP codes in the entire dataset. The final top 10 list was curated to highlight geographic diversity by selecting only the single ZIP code with the absolute highest median percentage change from each unique state.