
Table of Contents
After years of volatility, the 2025 housing market forecast looks to be a turning point in the right direction. Although prices continue to rise in most states, the pace is moderating, especially in high-cost coastal markets. Home sales are also starting to rebound as mortgage rates soften and more inventory returns to the market.
This year offers positive indicators like regional divergence and signs of renewed buyer activity. Let’s dive into the trends to watch, housing market predictions in the top 10 states, and how to stay ahead in an evolving market.
Key Takeaways
- Home prices are still climbing, but more slowly: New England states are seeing the strongest year-over-year price gains, with notable increases in Maine (+7%), Vermont (+6%), and Massachusetts (+2%). The Midwest is also showing modest growth. In contrast, prices are flat or even down in several Sun Belt markets—California (-0.3%) and Florida (-4%) among them.
- Inventory is finally improving: More homes are coming to market in 2025, giving buyers more options and slightly reducing competition for sellers.
- Regional differences are widening: Some states are surging ahead with strong sales and price growth, while others remain stalled due to affordability constraints or economic uncertainty.
National Housing Market Trends
As of Q2 2025, the median U.S. home price has reached $452,747, marking a 3% year-over-year increase. While home values continue to rise, the growth rate is moderate compared to the double-digit surges of previous years.
According to HouseCanary’s U.S. housing market forecast for 2025, prices will likely climb further into Q3 and Q4 2025, but at a slower, more sustainable pace, signaling a potential shift toward long-term market stabilization.
Inventory is finally recovering, with more sellers returning to the market. After hitting a low of just over 527,000 active listings in Q1 2022, inventory levels began to rebound, climbing to over 922,000 in Q2 2025.
While supply still falls short of pre-pandemic norms, the upward trend in available homes is helping to ease pressure on buyers and reduce the imbalance between supply and demand in many markets. Staying ahead of these trends with better market data is key to finding success in the market.
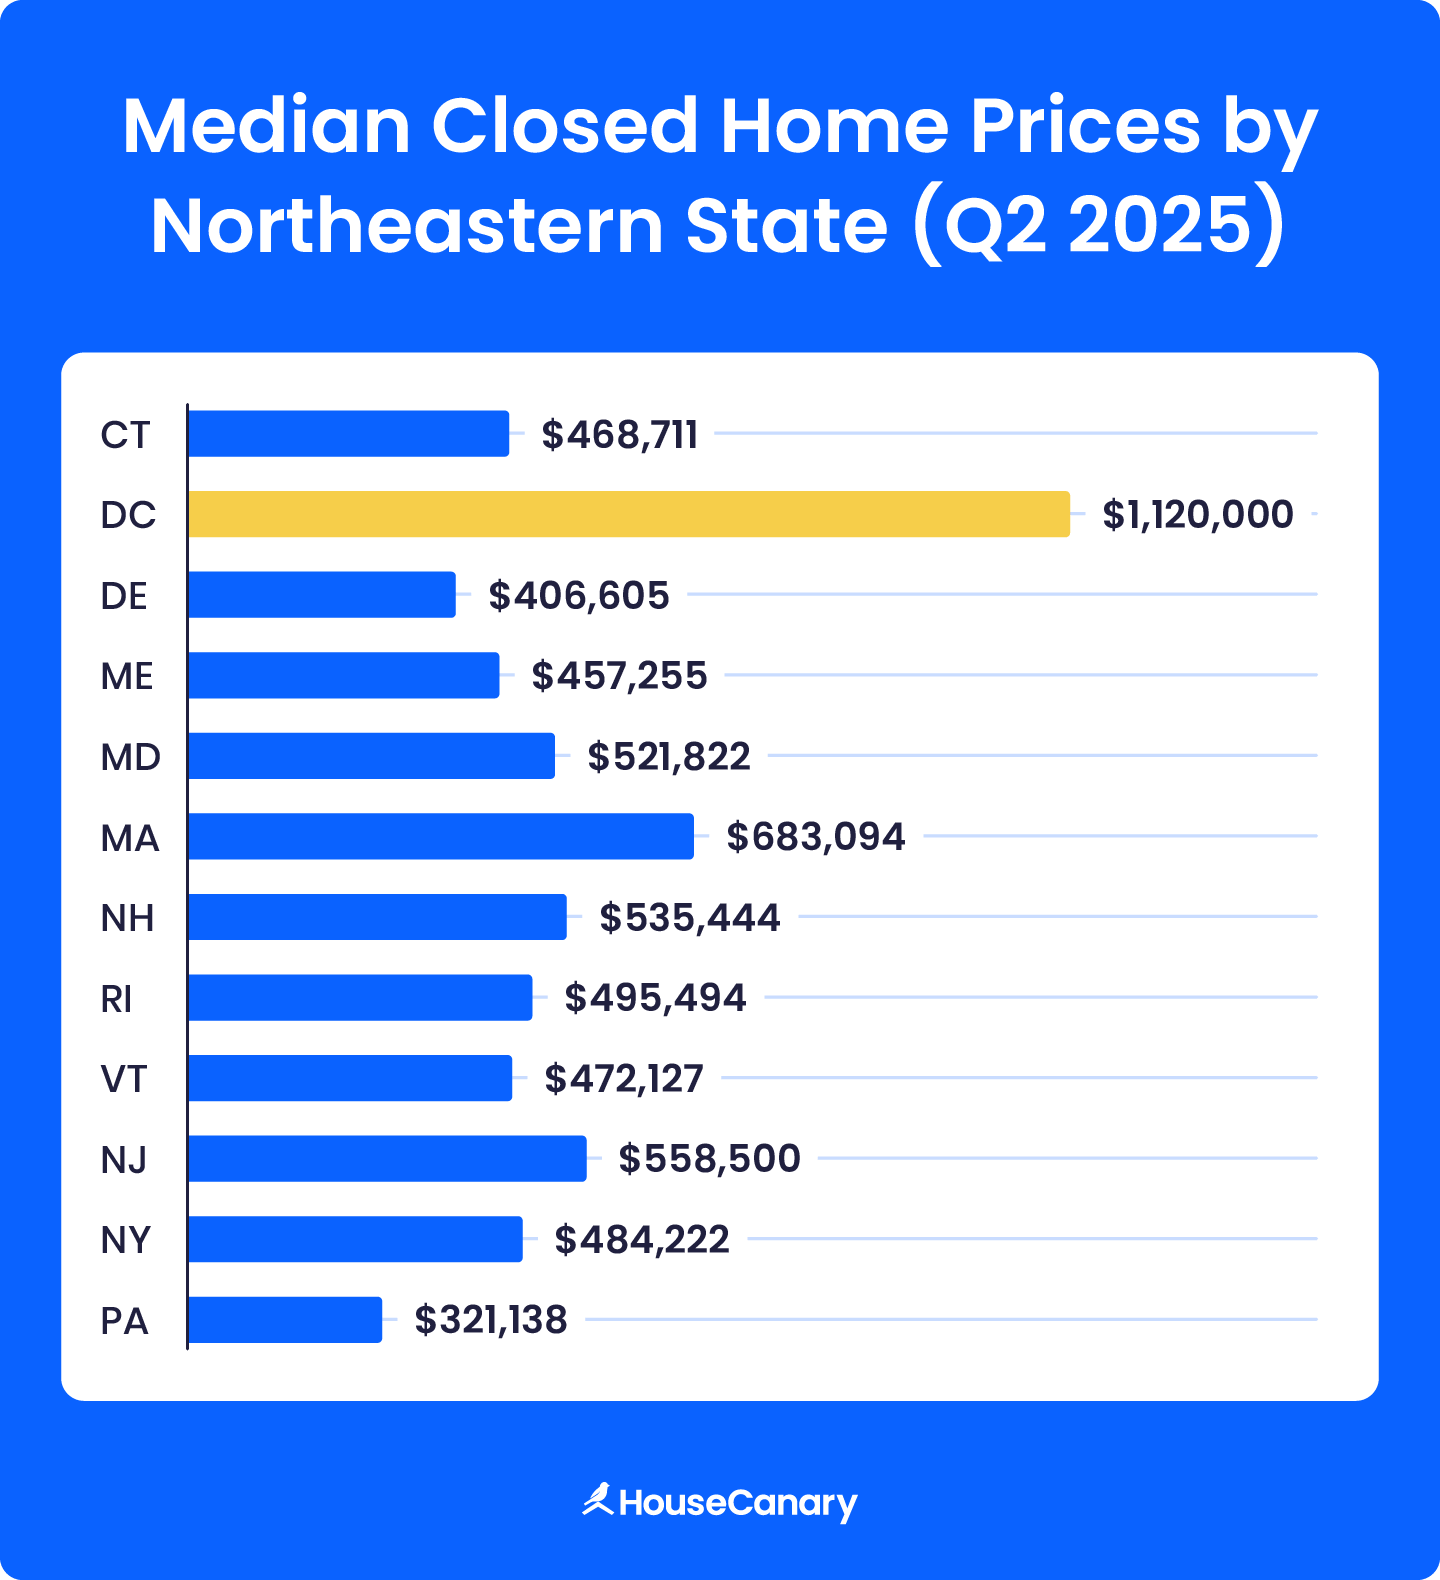
Let’s break home price trends by region, starting with the northeastern states where D.C. holds the top spot.
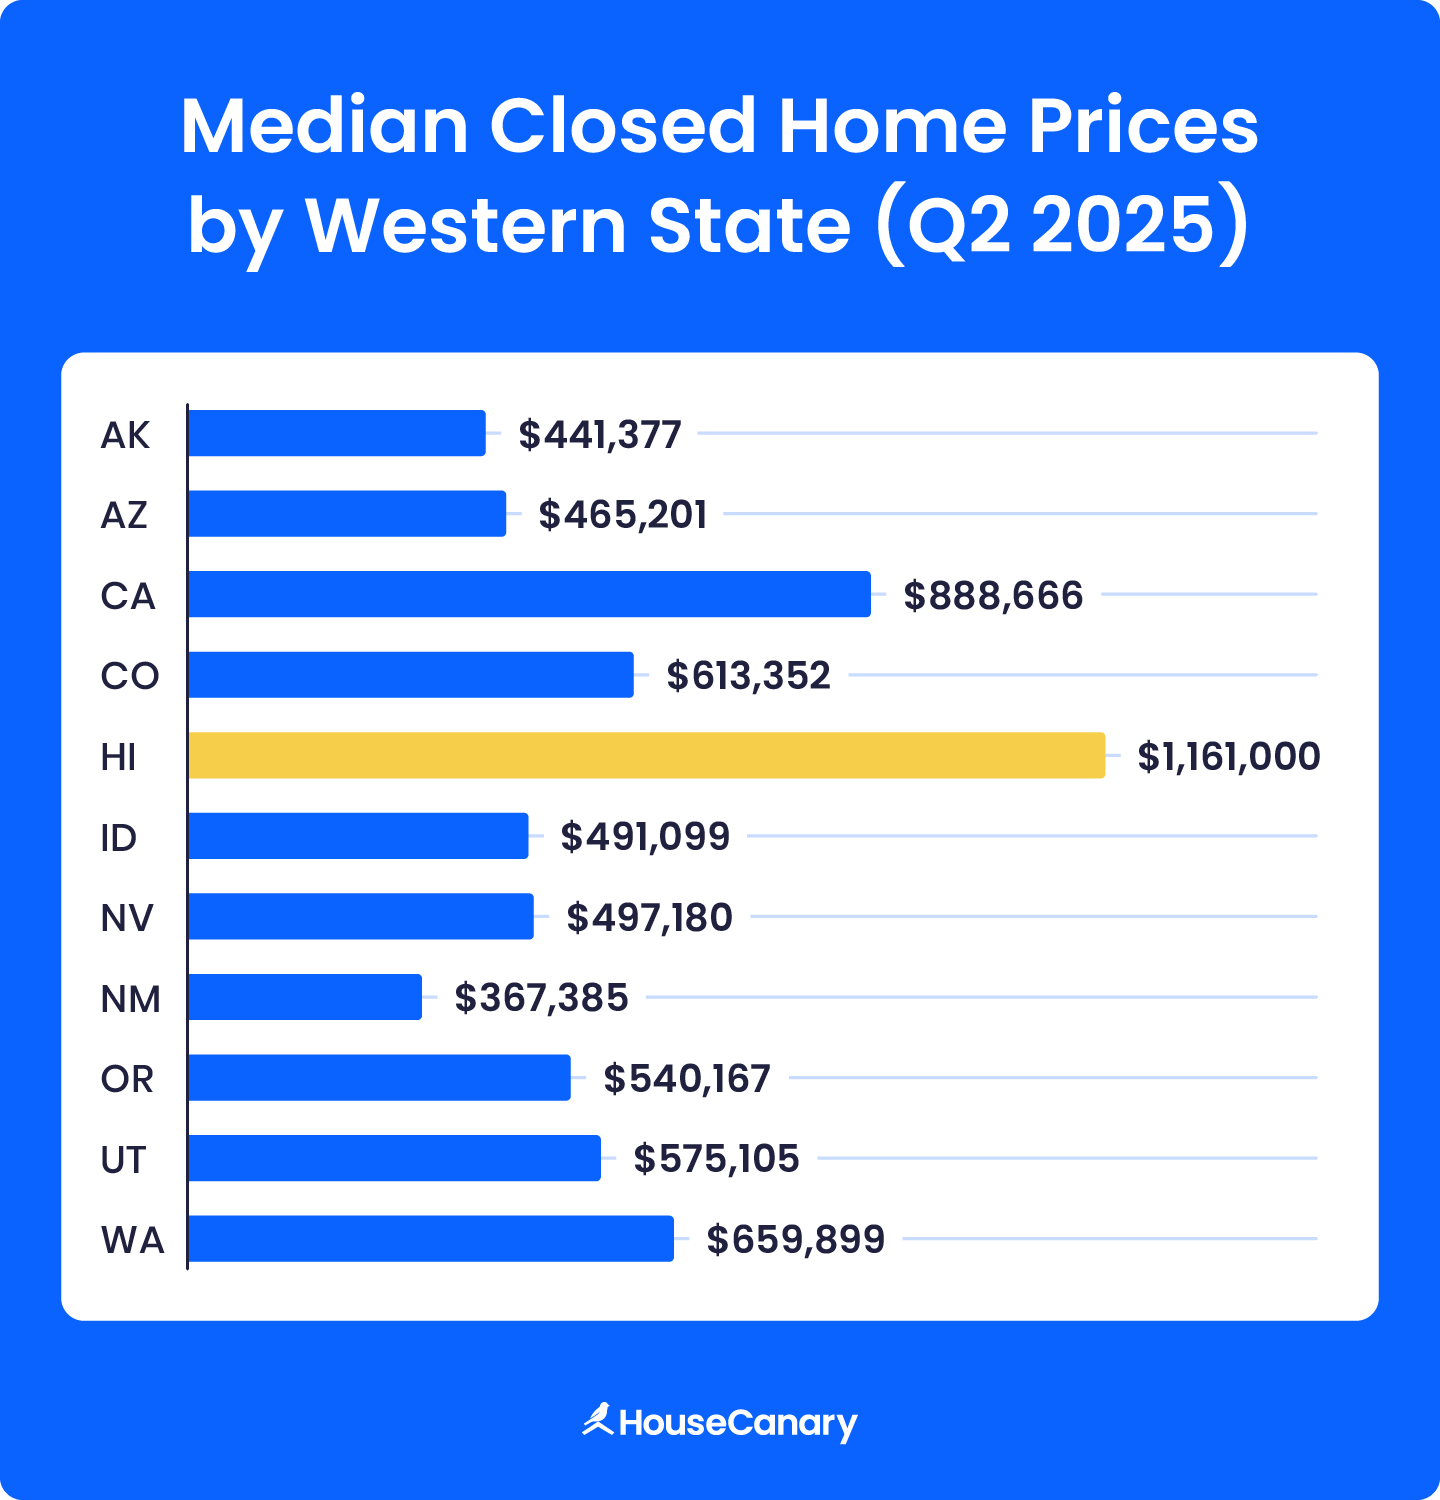
The West shows a wide range of prices, with coastal states like California far outpacing inland markets. Demand remains strong in tech-driven metros, keeping prices elevated despite cooling trends.
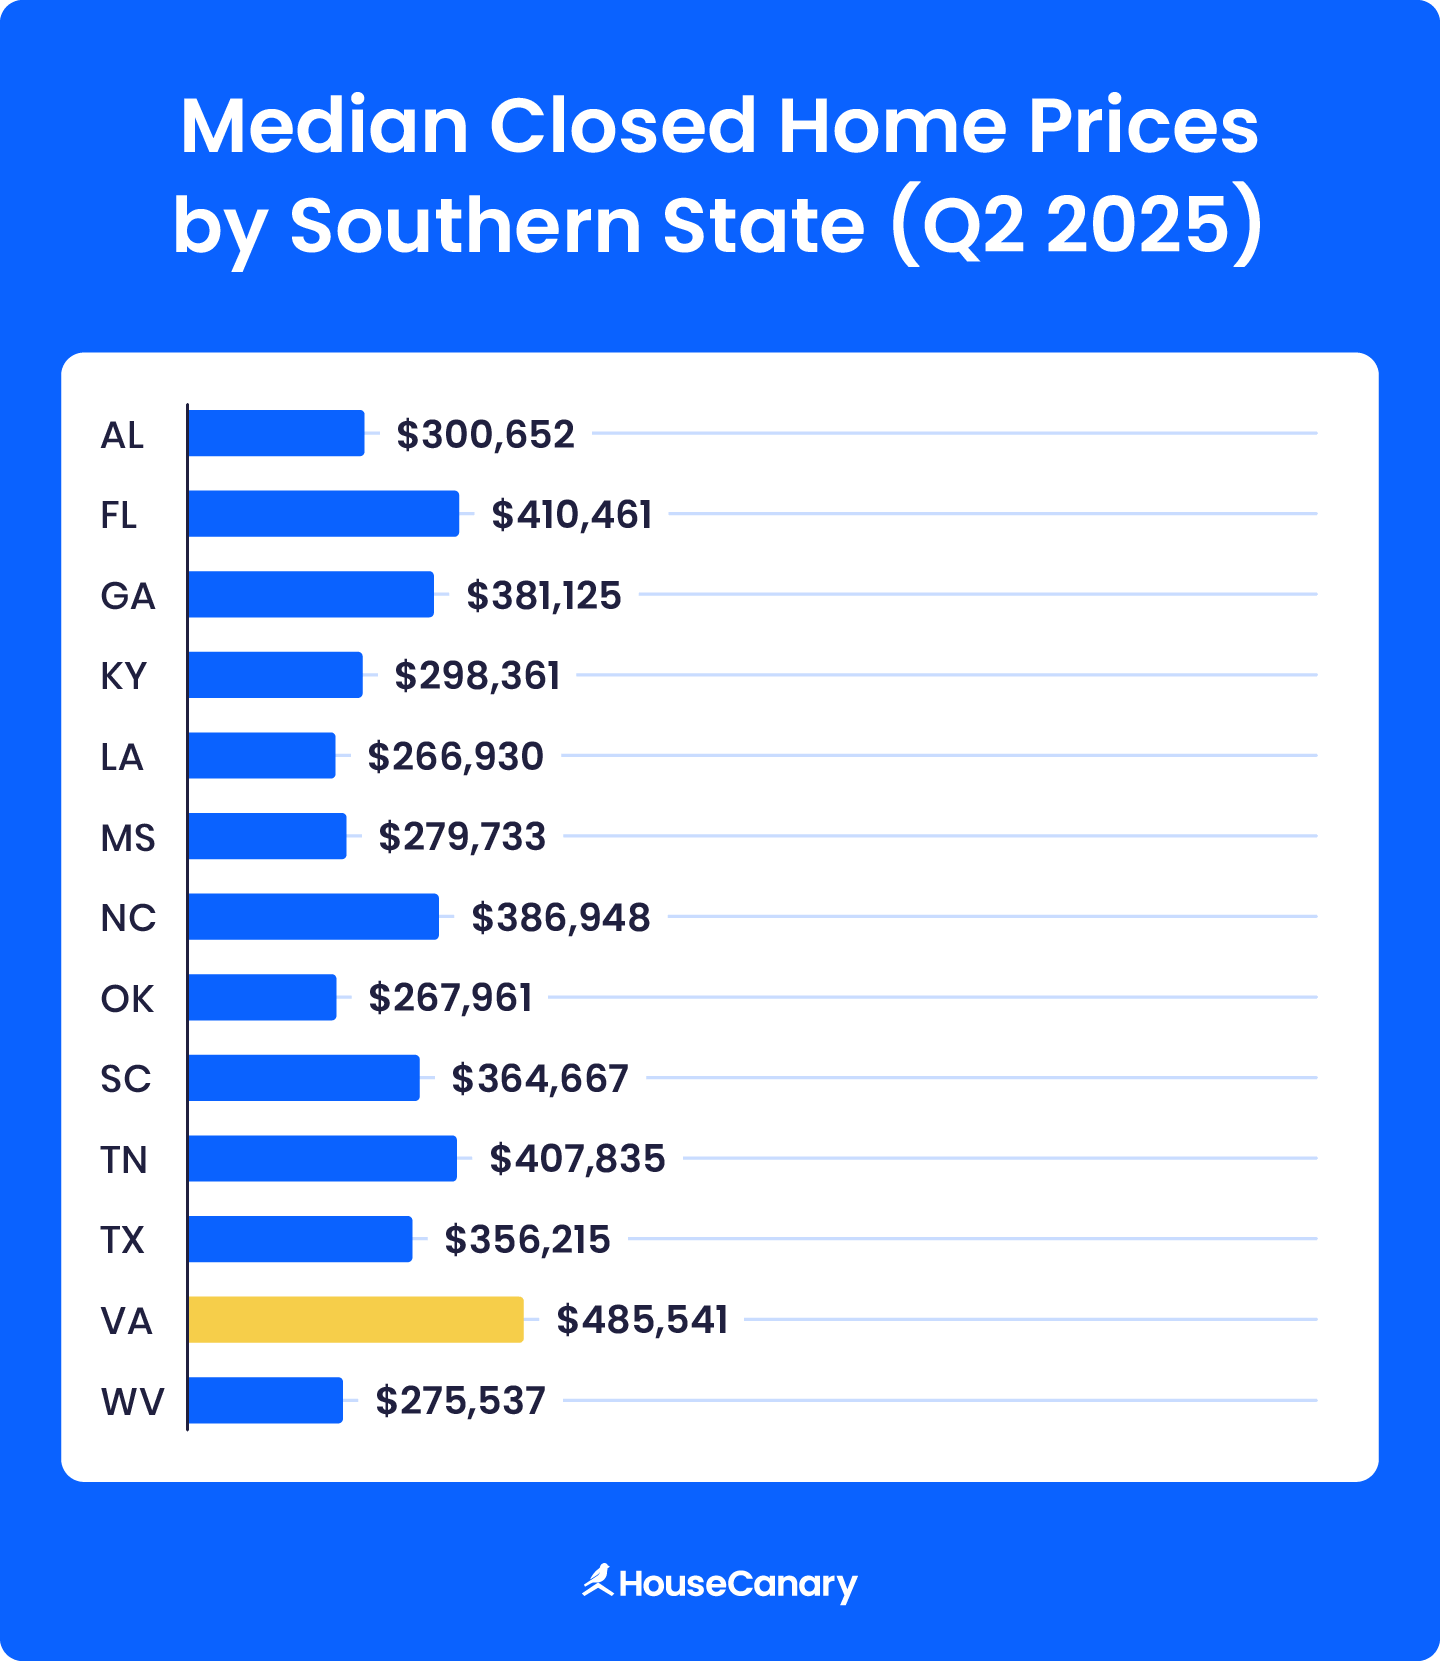
Southern states continue to attract buyers with lower costs of living and strong job growth. Markets like Virginia and North Carolina have seen price increases recently.
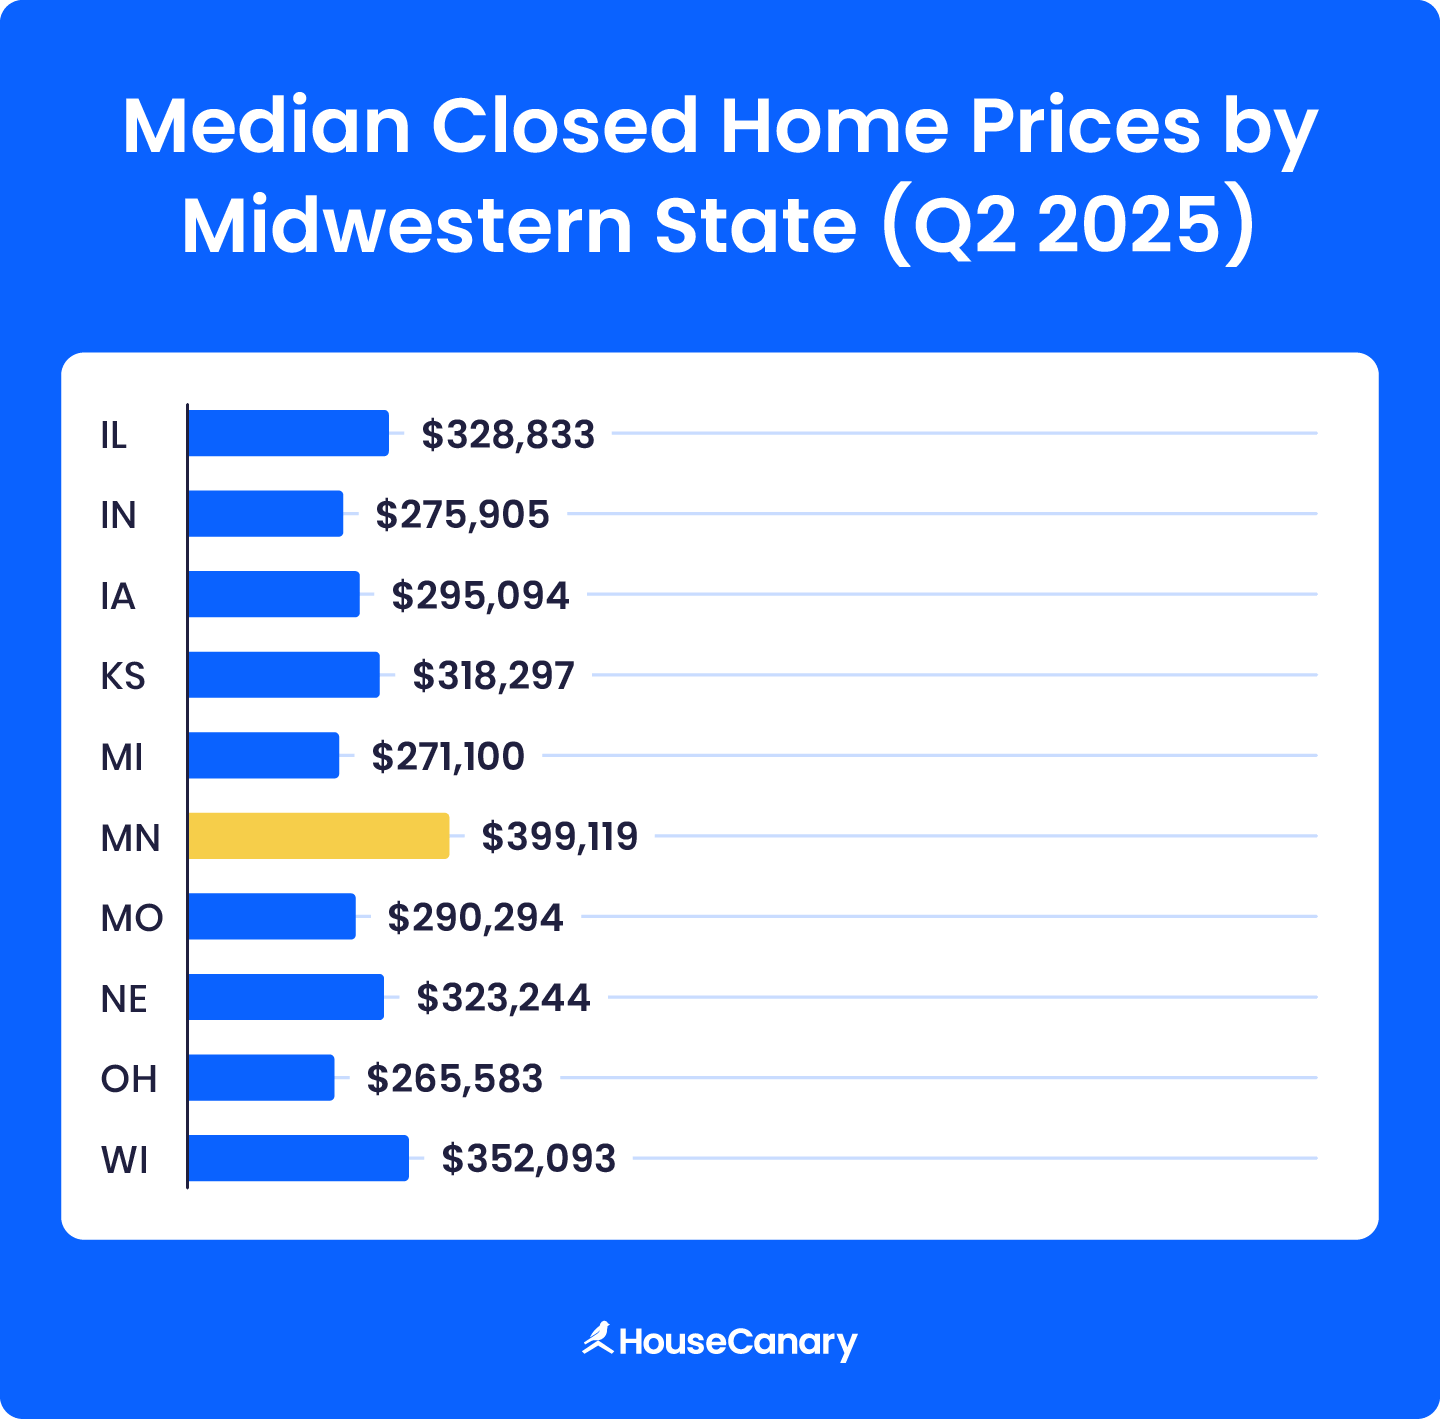
The Midwest remains one of the most affordable regions in the U.S. Despite slower growth, steady demand, and stable pricing characterize much of this region’s housing market.
Housing Market Forecasts for Top 10 States
Using the latest Q2 2025 data, we’ve identified the top 10 states poised for strong housing market performance based on these metrics:
- High median home values
- Strong buyer demand (measured by number of closings)
- Inventory levels
- Relatively low median days on market (DOM)
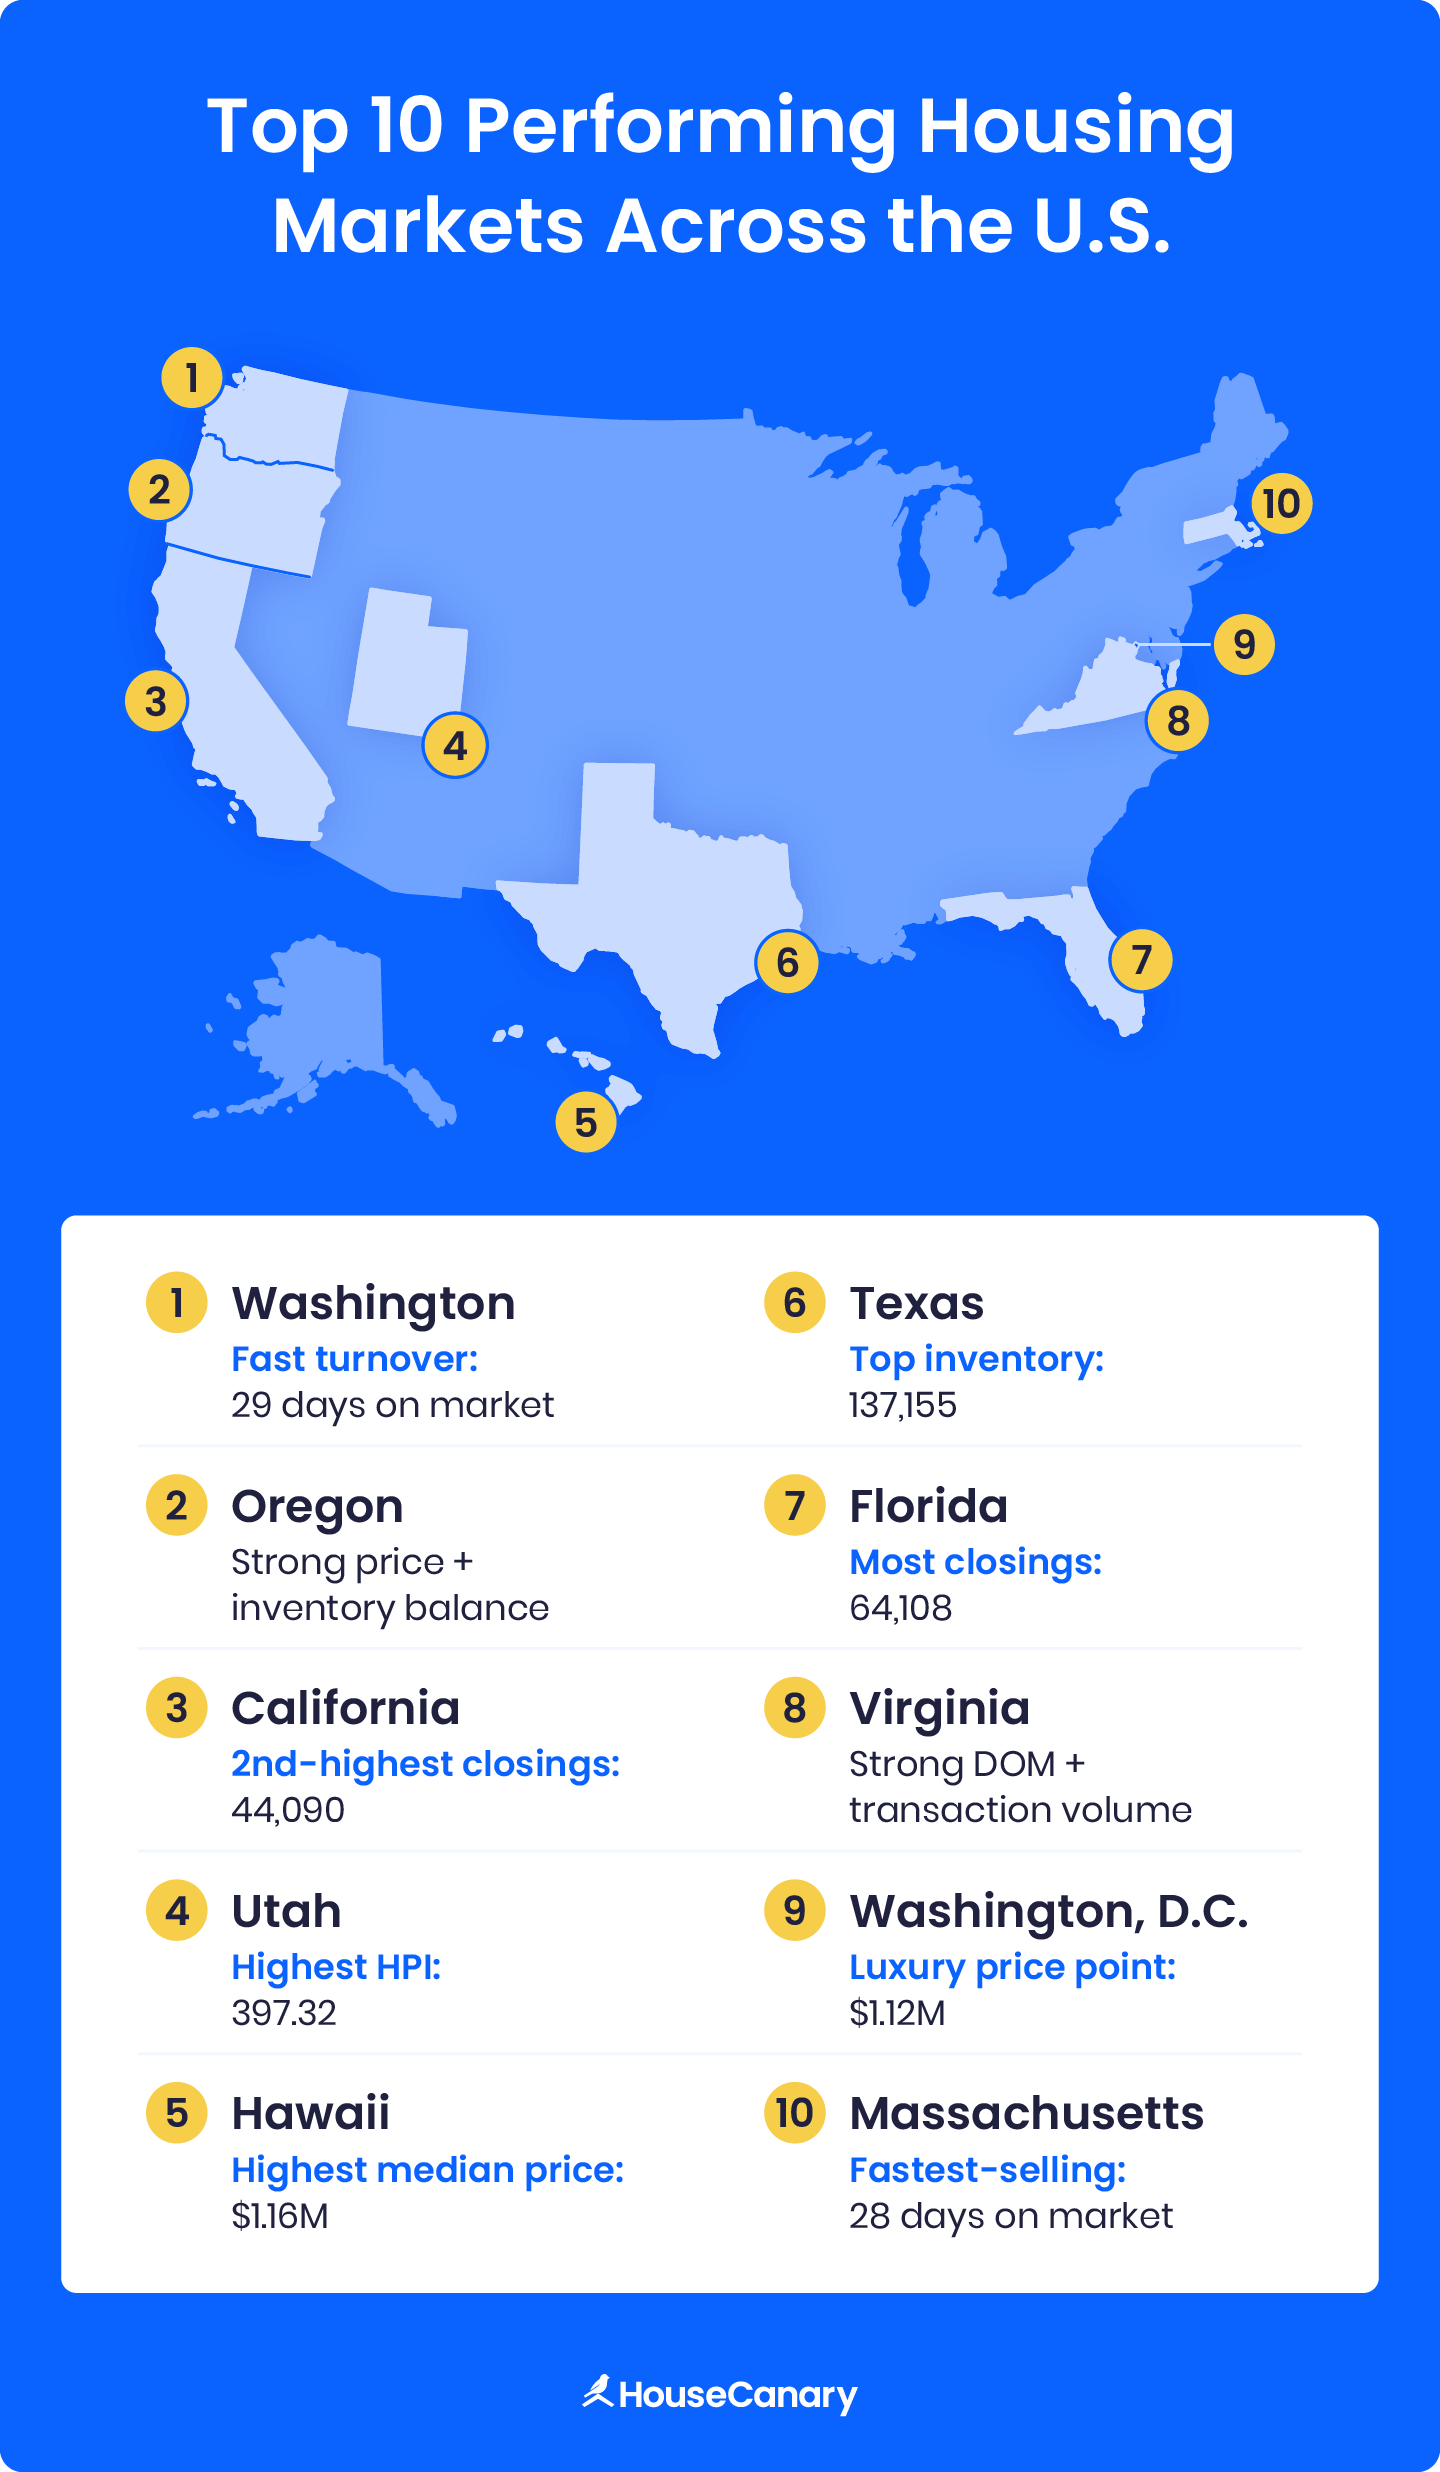
1. California
- Median closed price: $888,666
- Closings: 44,090
- Inventory: 54,173
- Median days on market: 37
With the second-highest number of closings and strong home prices, California remains a top force in the U.S. housing market. Despite moderate days on market, competition remains high in most major metro areas.
2. Florida
- Median closed price: $410,461
- Closings: 64,108
- Inventory: 132,788
- Median days on market: 62
Florida's housing market posted the highest number of closings nationwide, reflecting massive buyer demand. A growing inventory suggests that while homes take longer to sell, the market is deep, but prices are cooling.
3. Texas
- Median closed price: $356,215
- Closings: 72,710
- Inventory: 137,155
- Median days on market: 47
Texas continues to outperform thanks to its unmatched sales volume and abundant inventory. While home prices are more moderate, the high turnover rate and affordable entry points make it especially attractive to investors and first-time buyers alike.
4. Hawaii
- Median closed price: $1,161,000
- Closings: 680
- Inventory: 1,084
- Median days on market: 48
Hawaii commands the highest home prices in the country, reflecting its unique supply constraints and luxury appeal. Despite limited closings, the market's high value and fast-moving inventory support strong long-term investment potential.
5. Washington
- Median closed price: $659,899
- Closings: 17,646
- Inventory: 18,871
- Median days on market: 29
Homes in Washington are moving fast, with prices well above national averages. Its solid sales volume and low inventory levels point to continued upward pressure on prices in 2025
6. Washington, D.C.
- Median closed price: $1,120,000
- Closings: 340
- Inventory: 733
- Median days on market: 44
While small in scale, D.C. packs a punch with luxury-level pricing and limited supply. Its quick turnover rate indicates strong, consistent demand in a tightly constrained market.
7. Utah
- Median closed price: $575,105
- Closings: 6,663
- Inventory: 9,800
- Median days on market: 42
Utah boasts exceptional price growth. Homes are turning over quickly in a relatively small market, with pricing trends reflecting continued upward momentum into the next quarter.
8. Massachusetts
- Median closed price: $683,094
- Closings: 9,157
- Inventory: 10,404
- Median days on market: 28
Massachusetts showcases a classic high-demand, low-supply environment. With homes selling in under a month and pricing well above average, its market fundamentals remain strong, particularly in the greater Boston area.
9. Oregon
- Median closed price: $540,167
- Closings: 9,566
- Inventory: 14,474
- Median days on market: 39
Oregon’s market strength lies in its pricing growth and relatively fast-moving inventory. Its moderate home values appeal to both buyers and long-term investors seeking stable returns.
10. Virginia
- Median closed price: $485,541
- Closings: 16,895
- Inventory: 17,137
- Median days on market: 30
Virginia wraps up the top 10 with strong transaction volume, balanced inventory, and solid price appreciation. Its 30-day median DOM shows that homes are moving quickly, driven by demand in key regions like Northern Virginia.
Home Price Forecasts
Despite ongoing affordability challenges and rising inventory in many markets, a major housing market crash remains highly unlikely. Nationally, home prices could stabilize or rise modestly over the next year, according to HouseCanary’s proprietary HPI forecasts.
HouseCanary’s data shows continued upward momentum in many states through 2026:
- California: After a minor dip in late 2025, our data forecasts that prices will likely rebound, with HPI rising from 326.63 to 333.00 by Q2 2026, a 2% increase, showing long-term resilience in one of the nation’s most expensive markets.
- Florida: HPI should climb steadily from 351.63 to 352.69 by Q2 2026, reflecting a 0.30% increase and emphasizing continued demand in key metros like Miami and Tampa.
- Texas: With a massive volume of transactions and increasing inventory, Texas continues to experience high transaction volume but flat price growth. HPI will likely rise from 262.39 to 264.41 by Q2 2026, a 0.80% increase.
- Utah: Already leading the country in Q2 2025 with an HPI of 397.32, Utah is expected to rise to 408.46 by Q2 2026, a 3% increase, supported by strong demand and limited housing supply.
- Washington: With HPI projected to grow from 360.26 to 368.73 by Q2 2026, the state reflects a 2% increase, showing healthy appreciation, especially in metro areas like Seattle.
Understanding the housing market forecast across regions can help you price listings accurately and ensure you stay competitive across statewide volatility.
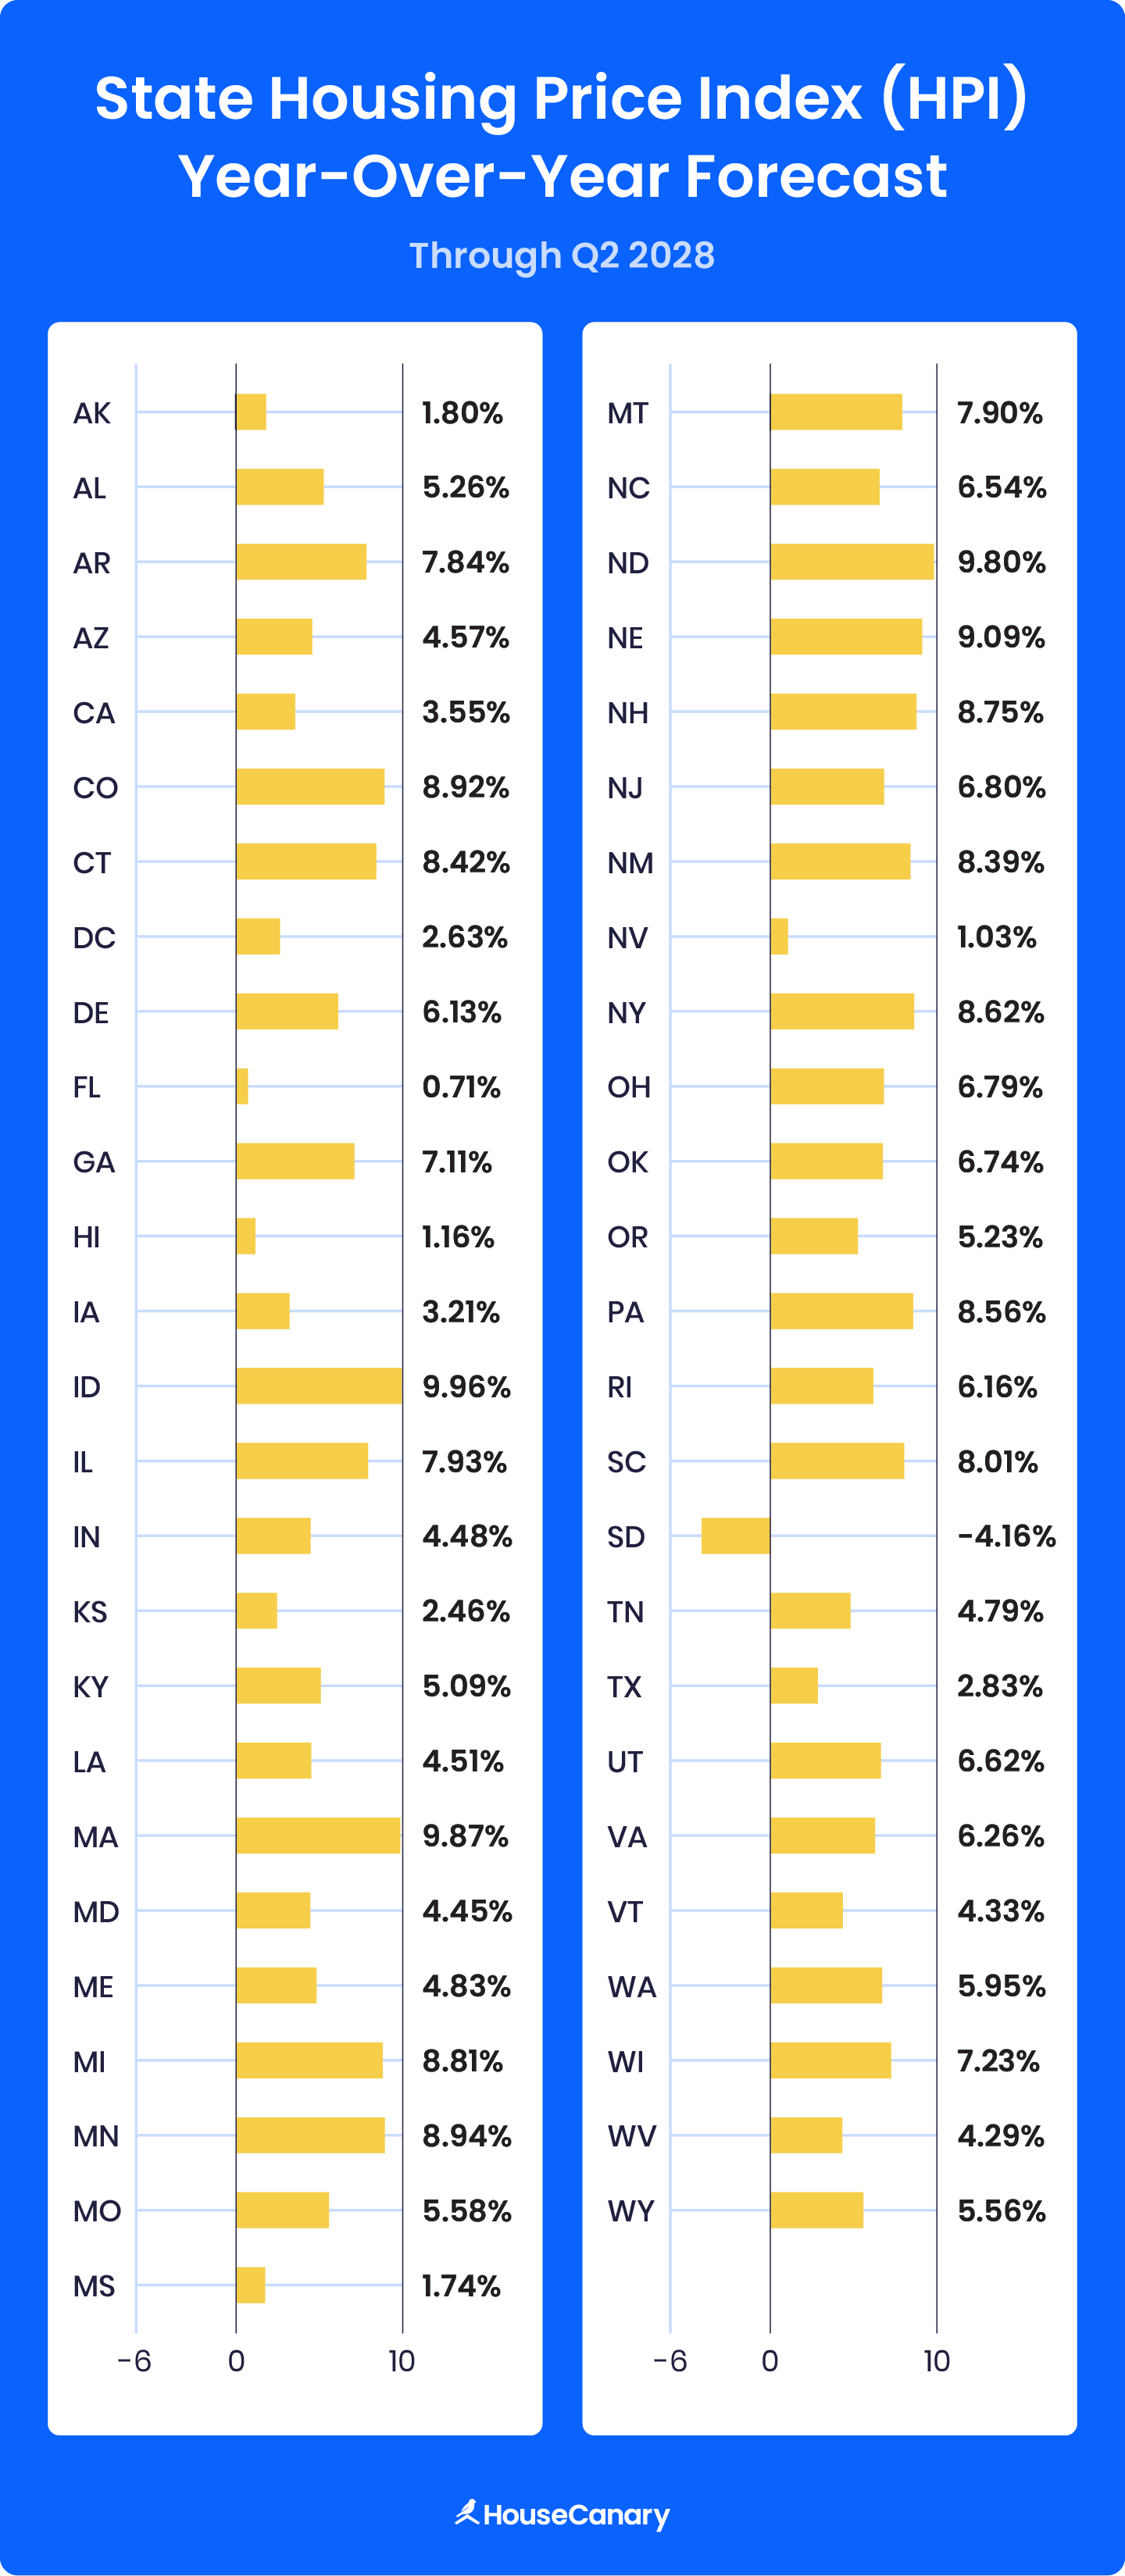
Long-Term Price Forecasts
HouseCanary’s long-term home price forecast through mid-2028 reveals a mixed outlook across the U.S., with some states poised for steady gains while others level off:
- Moderate national growth: Home prices will likely rise 5-10% in most states by mid-2028.
- Top-performing states: Idaho, Massachusetts, South Carolina, and Louisiana are forecasted to see gains of 8.8–10% through Q2 2028, leading the nation in home price growth.
- Solid mid-market strength: Montana and Washington could grow around 6%.
- Flat appreciation outlook: Hawaii, California, and Washington, D.C. will likely remain mostly unchanged.
Overall, HouseCanary’s data shows a shift toward more regionally balanced growth, with cooling in once-overheated markets and steady gains in underdeveloped or migration-driven states.
State Trends to Watch Throughout 2025
Our data shows that inventory will likely recover throughout 2025 in states like Texas and North Carolina, while affordability drives demand in Midwest markets such as Ohio and Indiana. Price growth will likely be strongest in states balancing economic opportunity and affordability, including Utah, Georgia, and Idaho. Conversely, high-cost states like New York and Illinois may experience slower growth.
Key factors influencing home value trends include interest rate changes, local job markets, housing policies, and insurance costs, especially in climate-sensitive areas. HouseCanary’s data and housing market forecasts for 2025 offer valuable insights, helping real estate professionals and investors make informed decisions as market conditions evolve.
Stay Ahead of the Market with HouseCanary
HouseCanary delivers a competitive edge by tracking housing trends at the state and neighborhood levels, covering more than 118 million residential properties nationwide. Powered by predictive AI tools, our models analyze thousands of advanced data points to produce forward-looking housing market forecasts.
That means you can spot risk, opportunity, and momentum before they show up in traditional indicators. Whether you're a broker, investor, or lender, HouseCanary helps you stay ahead of the curve and make confident, data-driven decisions.
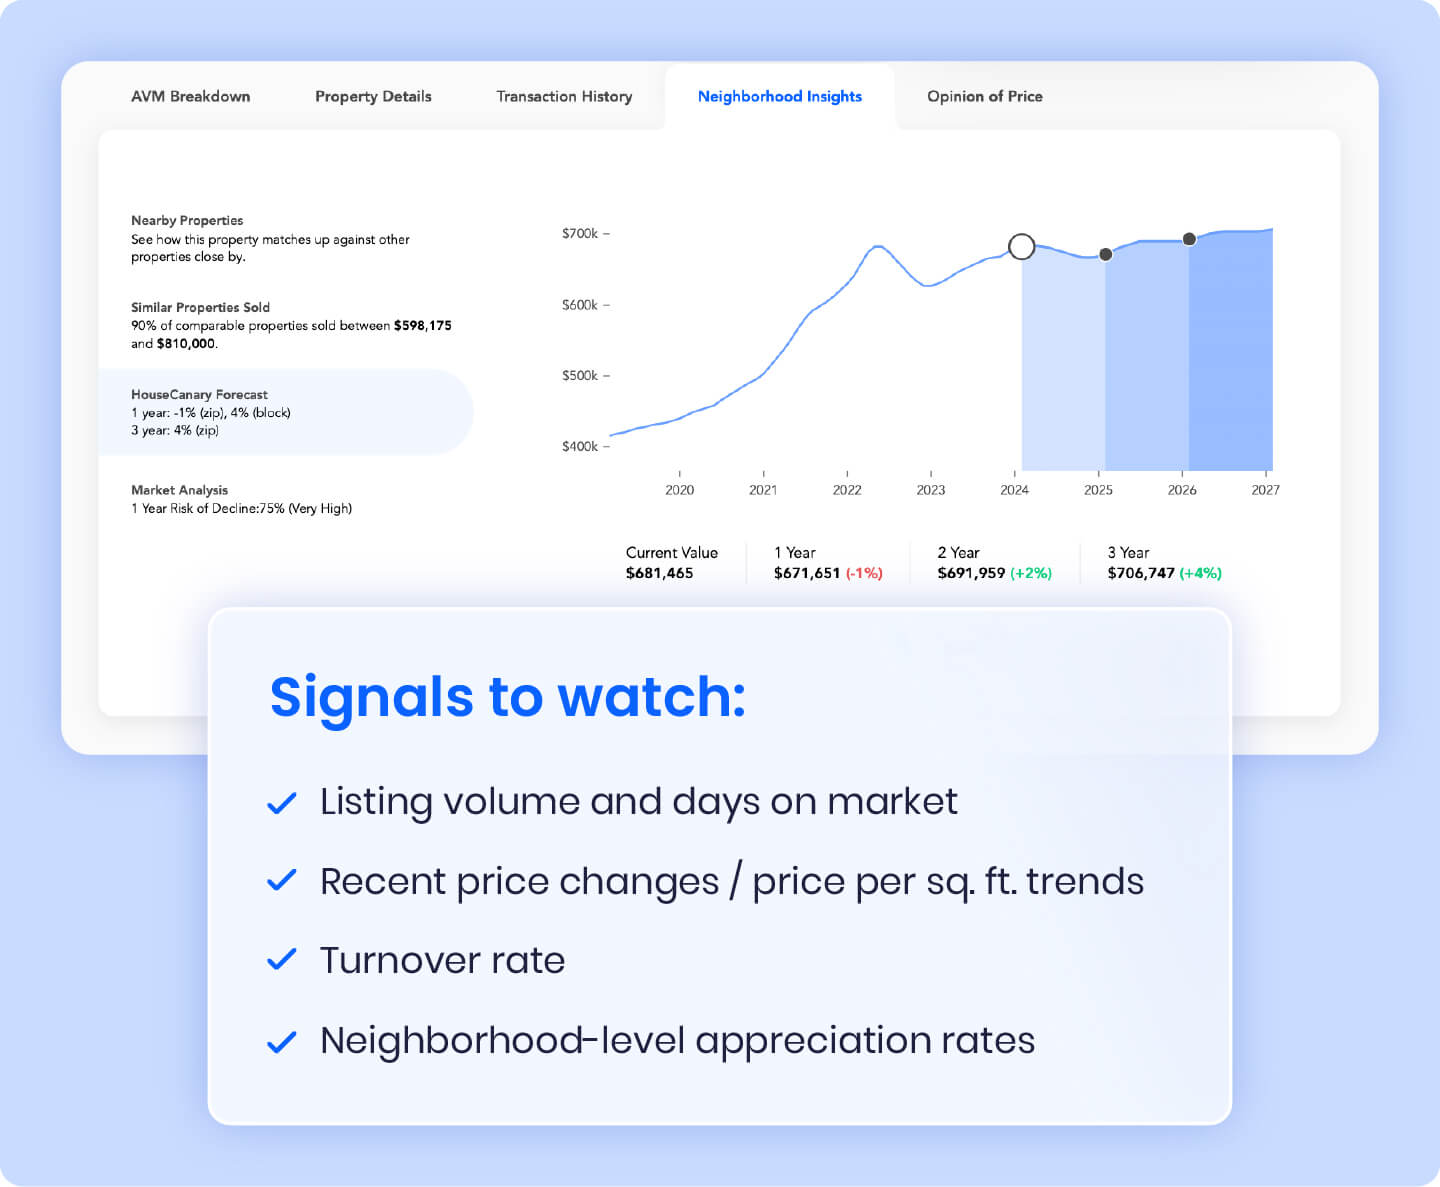
Want deeper visibility into your market? Try Property Explorer to monitor local trends and uncover early market signals at the street or ZIP code level.