
Bulk property data delivers comprehensive, pre-cleaned, and high-accuracy property data in a convenient, bulk format, empowering you to make informed decisions with confidence.

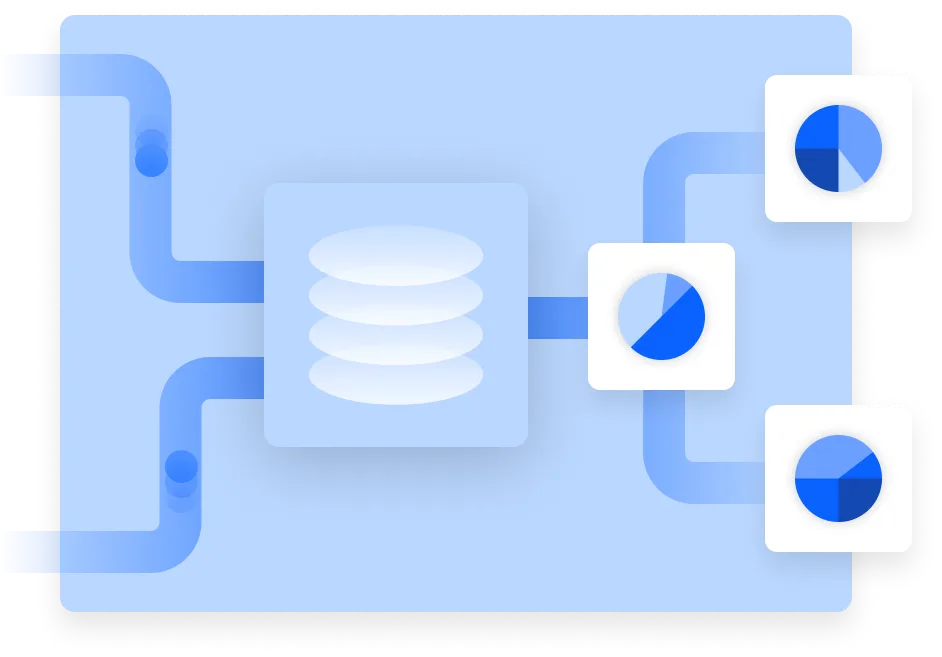
Our multi-sourced data undergoes rigorous normalization and cleansing processes using our proprietary pipelines. This means you receive ready-to-use property data in a single delivery that's reliable and free from inconsistencies, saving you valuable time and resources.
Schedule a Demo
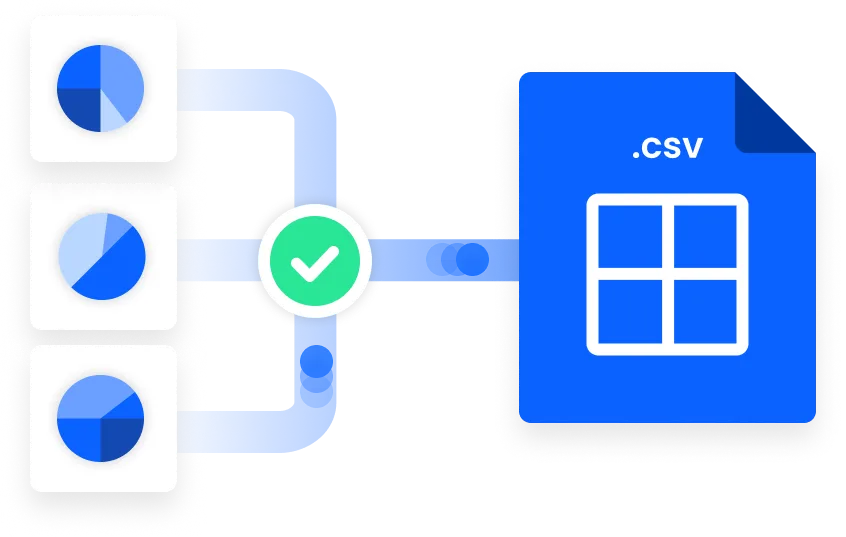
Forget about complex data manipulation and integration challenges. HouseCanary's Bulk Property Data arrives in a standardized .csv format, allowing for seamless extraction and integration with your existing systems and workflows. Receive monthly updates to ensure your data is always fresh and accurate.
Schedule a Demo
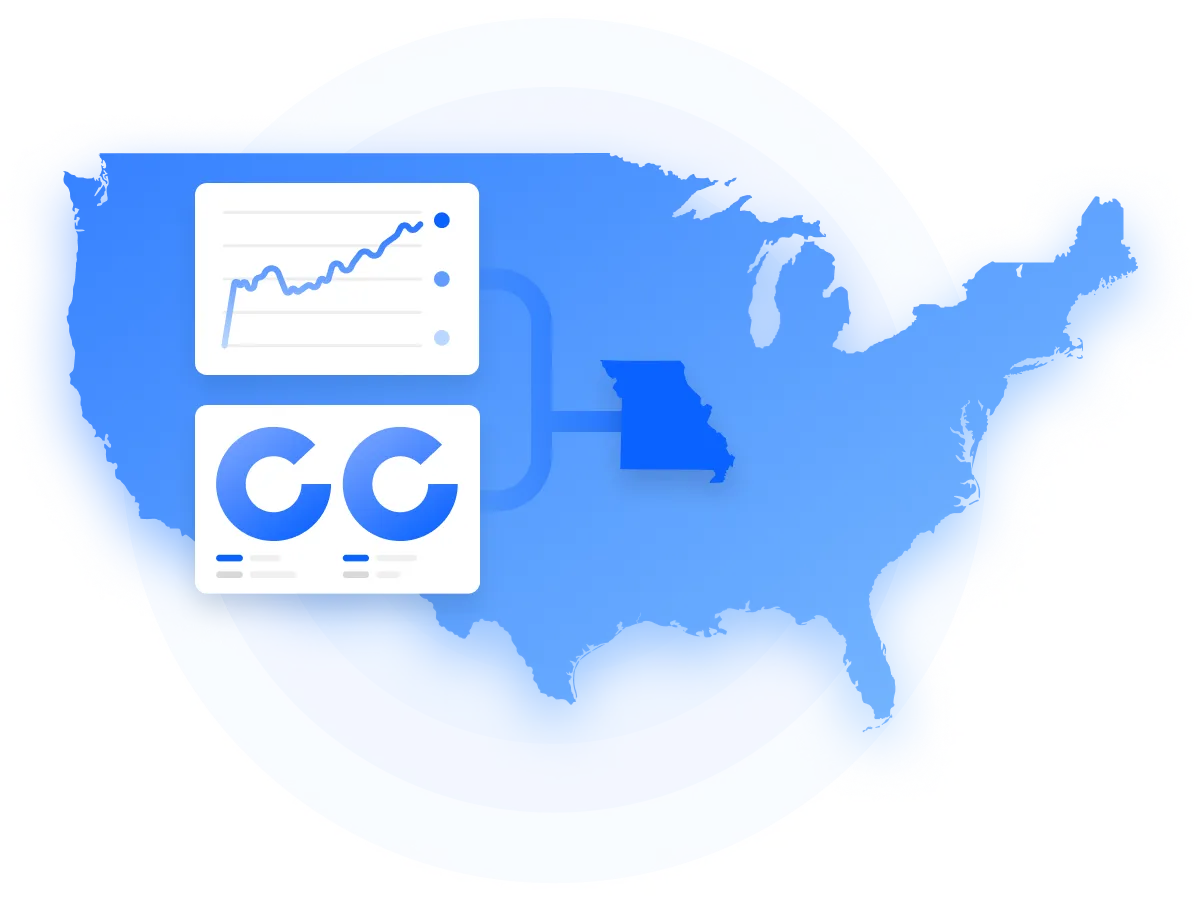
Access in-depth property details for all properties within your chosen geographic area. Whether you need data for the entire nation or a specific state, we offer flexible options to meet your needs.
Schedule a Demo
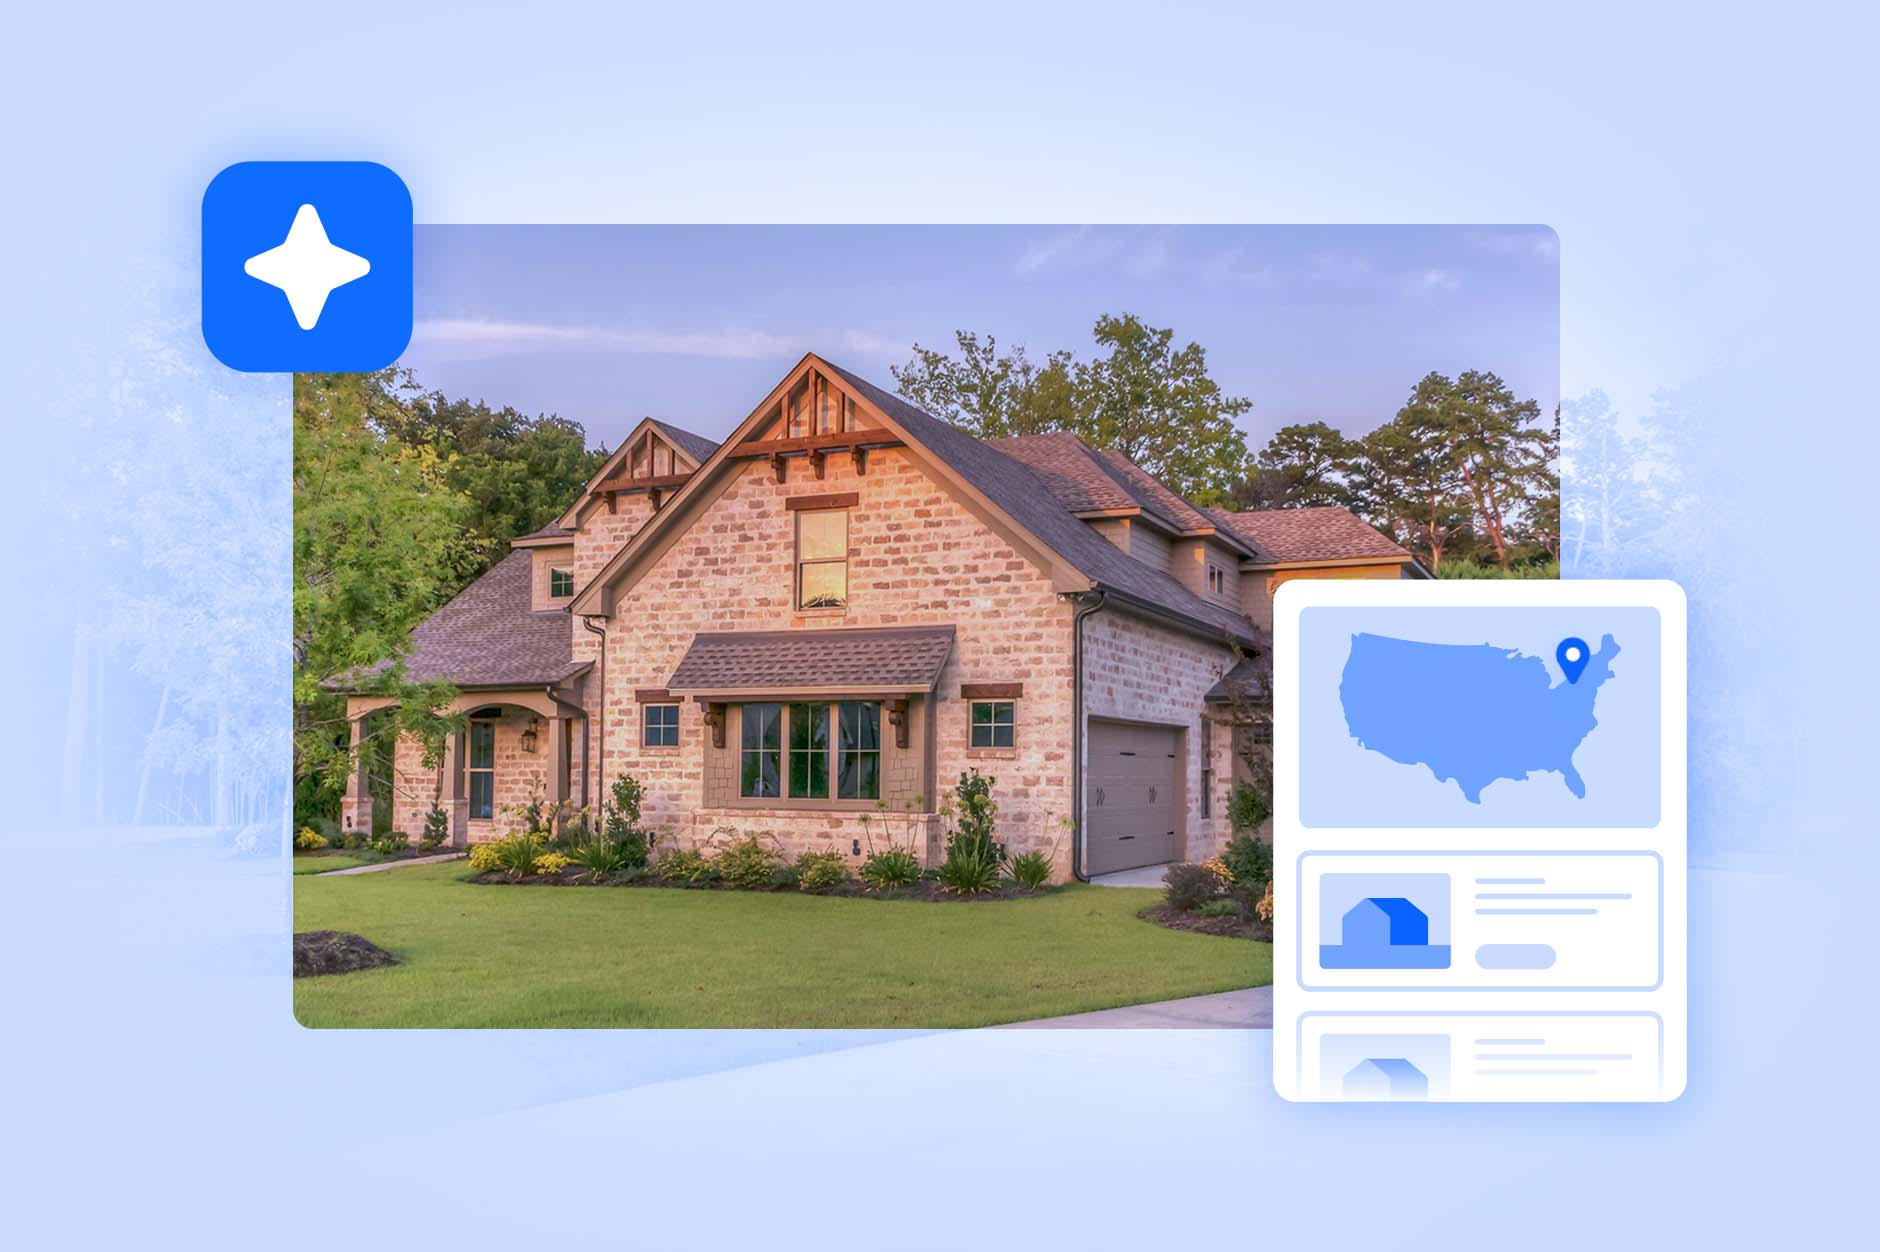
Discover which neighborhoods are poised for the biggest price jumps with HouseCanary’s CanaryAI.
Explore how HouseCanary’s AVMs are reshaping the real estate industry.

Access high-quality, pre-cleaned property data via AWS & Snowflake for smarter decisions.

We build groundbreaking technologies to improve and accelerate residential real estate operations.